What Happens When You Split a Random Technical Strategy Across 1, 3, 5, or 15 Accounts? Measuring the Effect of Diversification Alone With 5.7 Years of Real Data
※ This article is a backtest on real historical data. It does not guarantee future performance and is not investment advice. Assumptions and limitations are stated at the end.
"If a single account can blow up on bad luck, splitting into multiple accounts should smooth out the P&L" — that's the logic behind why a lot of people running multiple prop firm accounts keep adding more.
What this article wants to measure is the effect of diversification itself. We don't change the strategy. We don't change the sizing. The only thing we change is how the accounts are split. We look at how the yearly P&L changes when the same signal is routed into a single account versus split across 3, 5, or 15 accounts.
The strategy isn't cherry-picked for performance — it's textbook technical analysis. It has no edge. The question is: "can someone with no edge turn a profit purely from diversification?"
Here's the answer up front.
- The strategy itself is a loser. A 47.8% win rate, −0.045R expected value per trade. It's "no-edge" in the sense that it loses exactly the cost of the spread
- With 1 account, losing years happen. 1 out of 6 years was a loss, averaging +¥960K/year
- Splitting into 5+ accounts eliminates losing years. 0/6 for 5 accounts, 0/6 for 15 accounts. The 15-account average is +¥3.95M/year
- Individual accounts lose money half the time. Across 15 accounts × 6 years = 90 account-years, 50 were losses. Bundled together, all 6 years are profitable
Diversification doesn't create profit. It erases the bad years. That's what this backtest shows.
The setup (fixed, never changed)
First we lock down the container design, and it's never touched again after this. Each account only opens one trade per day — that's the starting point.
| Entry rule | One trade per account, per day. Enter on the first signal of the day; ignore everything else that day |
| Risk | Lot size set so the distance to the stop-loss equals 2% of the account |
| Stop-loss / take-profit | SL 2×ATR / TP 2×ATR (RR 1:1). Time-stop at 48 hours |
| Strategy | 20/50 MA cross / Bollinger 50-period ±2σ mean reversion / 20-bar high/low breakout |
| Direction | Trades both long and short (cross goes either way, bands go both extremes, breakout goes either direction) |
| Symbols | USDJPY, gold, US30, BTCUSD — 4 symbols, same set for every account |
| Cost | Actual MT5 spread. Longs enter at Ask/exit at Bid; shorts enter at Bid/exit at Ask |
| Account | $100,000, 2-Step (targets 8% → 5%), max DD 10% static, daily DD 5%, profit split 80% |
| Payout | Request at +4%, 14-day cycle. Fee per attempt ¥74,000; re-buy 7 days after a blown account |
| Period | January 2021 – September 2026 (5.7 years). Signals on the 1-hour chart, SL/TP hits checked on the 5-minute chart |
"Once a day, 2% risk" is a basic prop-account design principle: if there's only one 2% trade per day, you can't reach a 5% daily loss limit. Why we fixed this assumption is explained in the FAQ.
With that fixed, we only vary how the accounts are split, in 4 ways.
| Split | # of accounts | Contents of each account |
|---|---|---|
| 1 account | 1 | All signals from 3 strategies × 5 weekdays flow into one account |
| 3 accounts (by strategy) | 3 | One account per strategy, regardless of weekday |
| 5 accounts (by weekday) | 5 | One account per day-of-week the trade was entered, regardless of strategy |
| 15 accounts (strategy × weekday) | 15 | One account per strategy × weekday combination |
Whichever split you use, the incoming signals are identical. The only difference is how many accounts share "that day's one trade."
First: the strategy itself is a loser
Before running it through any account container, we measured the raw expectancy of the strategy alone. 4 symbols, both directions, 34,518 trades.
| Symbol | Trades | Win rate | Expectancy (R) |
|---|---|---|---|
| USDJPY | 8,445 | 48.7% | −0.027 |
| Gold | 8,274 | 48.7% | −0.024 |
| US30 | 7,531 | 47.3% | −0.056 |
| BTCUSD | 10,268 | 46.6% | −0.069 |
| Total | 34,518 | 47.8% | −0.045 |
A 47.8% win rate at RR 1:1. You lose exactly the spread on top of a coin flip — that's what this "random technical strategy" really is. There's no edge here.
So everything that follows is about what happens to a losing strategy when you run it through the same container, only splitting the accounts differently.
Changing only the split
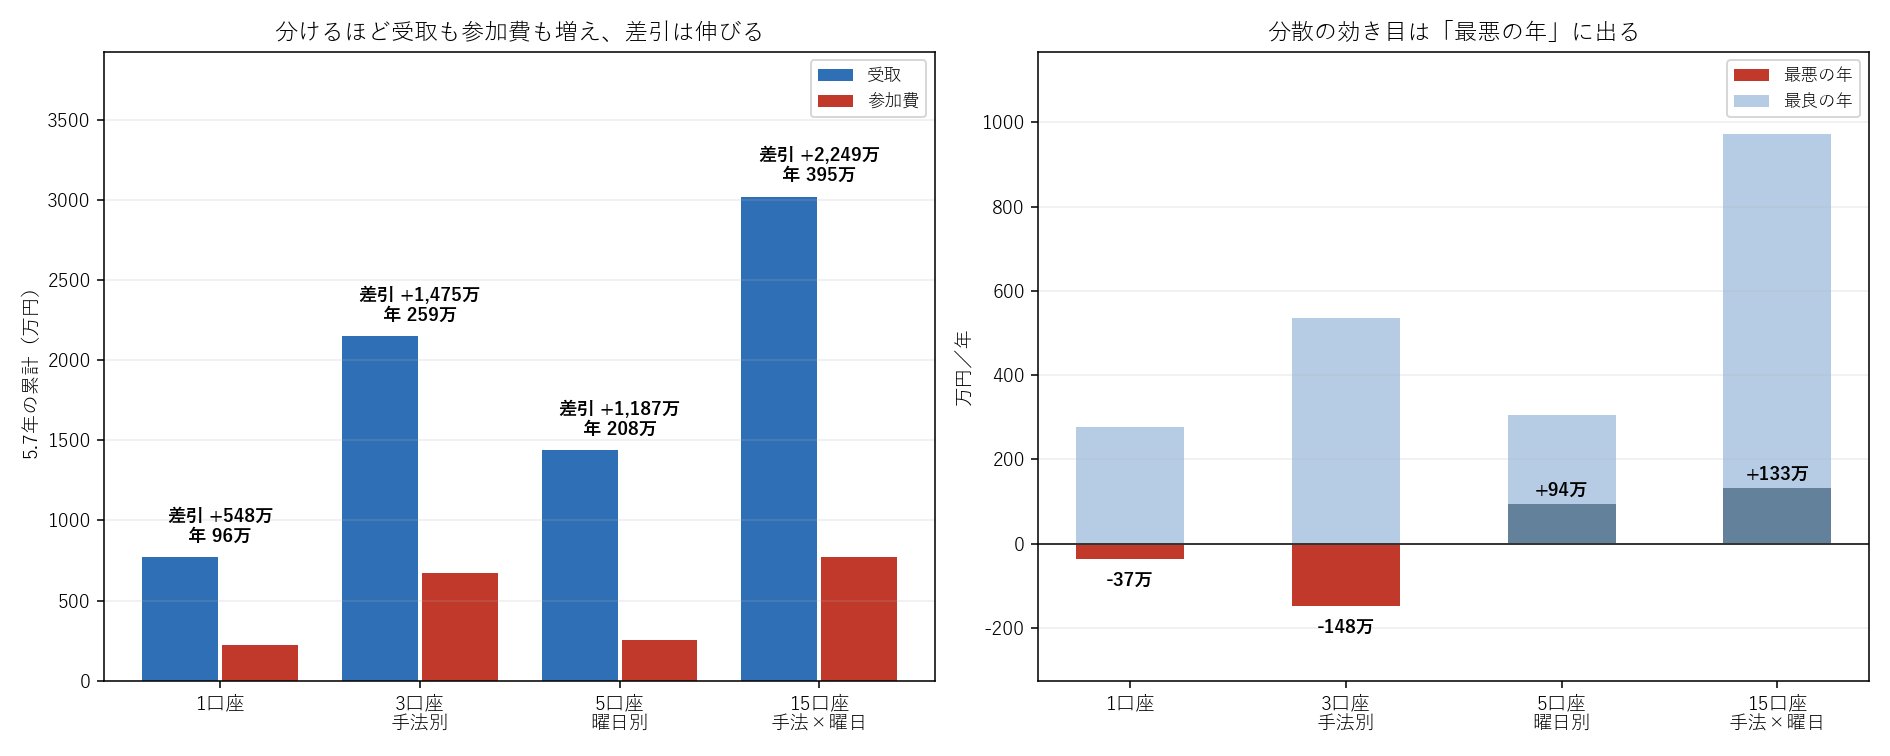
| Split | Accounts | Trades | Blowups | Payouts | Fees | Net | Per year | Per account/year | Losing years |
|---|---|---|---|---|---|---|---|---|---|
| 1 account | 1 | 1,346 | 30 | ¥7.70M | −¥2.22M | +¥5.48M | +¥960K | ¥960K | 1/6 |
| 3 accounts (by strategy) | 3 | 3,742 | 91 | ¥21.49M | −¥6.73M | +¥14.75M | +¥2.59M | ¥860K | 2/6 |
| 5 accounts (by weekday) | 5 | 1,488 | 34 | ¥14.38M | −¥2.52M | +¥11.87M | +¥2.08M | ¥420K | 0/6 |
| 15 accounts (strategy × weekday) | 15 | 4,189 | 104 | ¥30.19M | −¥7.70M | +¥22.49M | +¥3.95M | ¥260K | 0/6 |
All 4 splits are profitable over the full 5.7 years. A losing strategy still ends up net positive because of the structure of prop firms (downside is capped at the fee, upside is uncapped at an 80% split) — that has nothing to do with the split.
What the split changes is whether there are losing years. 1 account has 1 losing year out of 6; 3 accounts has 2. 5 accounts and 15 accounts have zero.
A caveat first: adding accounts also adds more "once-a-day" slots. 15 accounts open up to 15 trades a day combined, so both payouts and fees balloon to about 4x a single account. Normalized per account, it drops from ¥960K down to ¥260K. The growth in the absolute net figure isn't the effect of diversification — it's the effect of more slots. To see diversification actually working, you need to look at the year-by-year breakdown.
Looking at it year by year
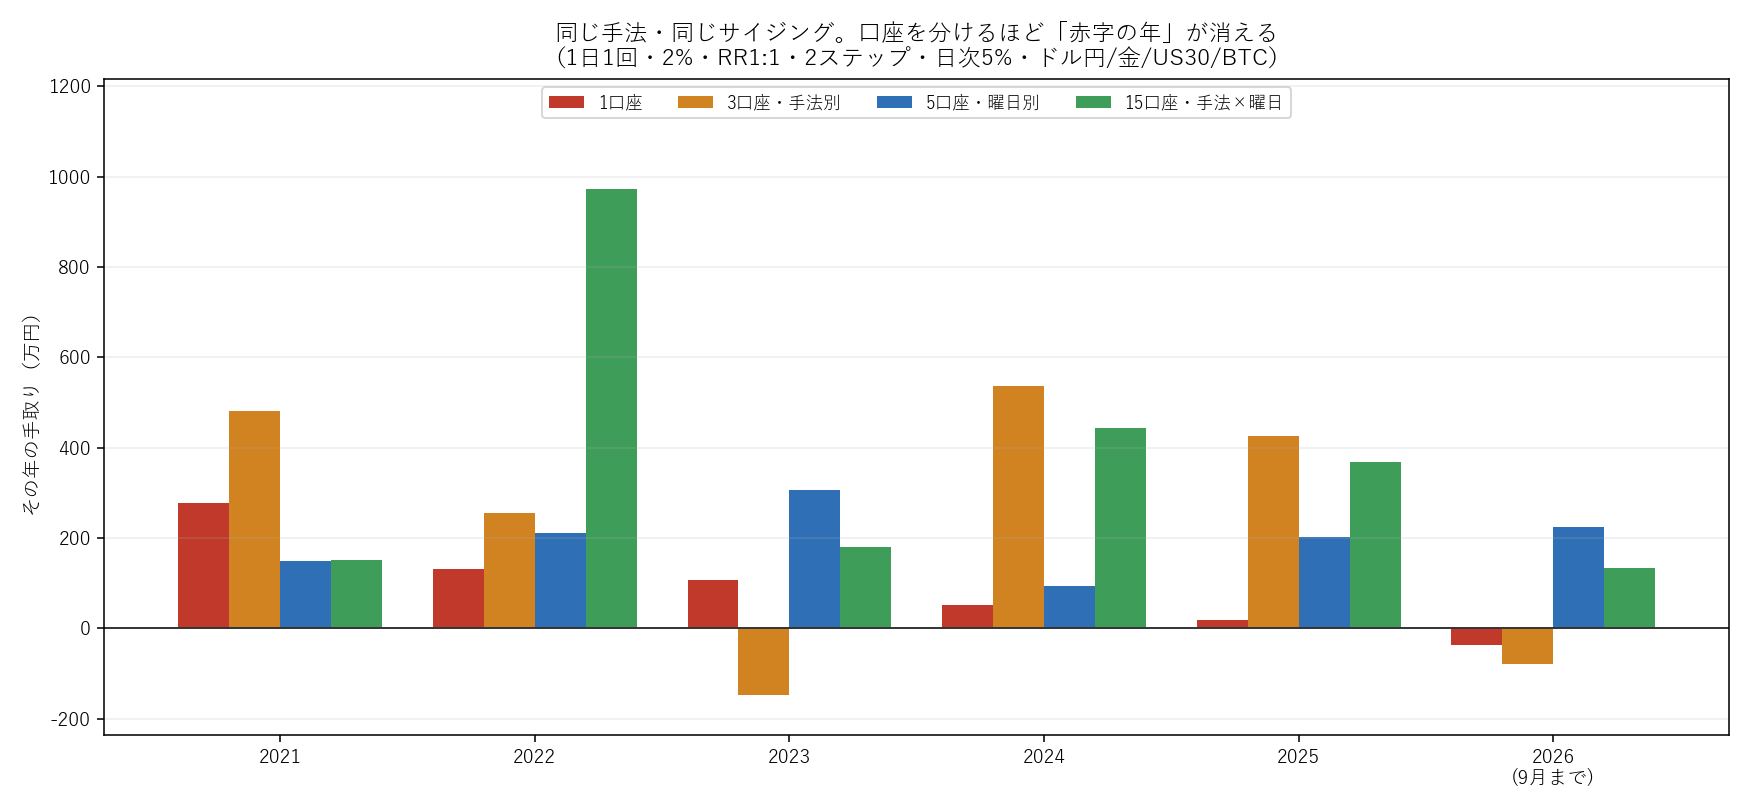
| ¥ (millions) | 2021 | 2022 | 2023 | 2024 | 2025 | 2026 (through Sep) | Worst year |
|---|---|---|---|---|---|---|---|
| 1 account | +2.77 | +1.31 | +1.07 | +0.52 | +0.18 | −0.37 | −0.37 |
| 3 accounts (by strategy) | +4.82 | +2.56 | −1.48 | +5.37 | +4.27 | −0.78 | −1.48 |
| 5 accounts (by weekday) | +1.49 | +2.10 | +3.06 | +0.94 | +2.03 | +2.24 | +0.94 |
| 15 accounts (strategy × weekday) | +1.51 | +9.73 | +1.81 | +4.43 | +3.68 | +1.33 | +1.33 |
5 accounts (by weekday) is the flattest. The worst year is +¥940K and the best is +¥3.06M — only a 3.3x range across the 6 years. 15 accounts ranges from +¥1.33M to +¥9.73M — a 7.3x range — but its floor is still higher than the 5-account floor.
3 accounts (by strategy) can post big gains in good years, but in 2023 all 3 strategies lost at the same time (MA cross −¥370K, Bollinger −¥440K, breakout −¥670K), and even bundled together it comes to −¥1.48M. With only 3 units, there are years where all of them miss at once.
The 1-account line trends down year over year, but that's just the result of one particular path — it shouldn't be read as a trend. What matters here is the fact that "a single account produces losing years," not the trajectory itself.
Individual accounts lose money half the time
Breaking the 15 accounts down one by one shows what diversification is actually doing.
| ¥ (millions) | 2021 | 2022 | 2023 | 2024 | 2025 | 2026 | Total |
|---|---|---|---|---|---|---|---|
| MA cross · Mon | −0.07 | +0.48 | −0.15 | 0 | −0.15 | −0.07 | +0.04 |
| MA cross · Tue | +0.48 | +1.92 | −0.07 | −0.15 | −0.15 | −0.15 | +1.88 |
| MA cross · Wed | +0.33 | +0.41 | 0 | +0.41 | +0.96 | −0.15 | +1.96 |
| MA cross · Thu | +1.44 | +1.85 | −0.15 | 0 | −0.07 | −0.15 | +2.92 |
| MA cross · Fri | 0 | +1.21 | +0.41 | +2.48 | −0.15 | −0.15 | +3.80 |
| Bollinger · Mon | −0.07 | −0.15 | −0.07 | +0.96 | −0.22 | −0.07 | +0.37 |
| Bollinger · Tue | 0 | −0.22 | +0.89 | +1.14 | −0.15 | −0.15 | +1.51 |
| Bollinger · Wed | 0 | +0.41 | −0.30 | −0.07 | 0 | +0.89 | +0.92 |
| Bollinger · Thu | −0.07 | −0.07 | −0.07 | −0.15 | −0.07 | −0.07 | −0.52 |
| Bollinger · Fri | 0 | −0.07 | −0.22 | −0.07 | +1.80 | +0.48 | +1.91 |
| Breakout · Mon | −0.15 | −0.07 | −0.15 | −0.15 | −0.07 | −0.15 | −0.74 |
| Breakout · Tue | −0.22 | +1.68 | −0.15 | −0.07 | +0.41 | +0.81 | +2.45 |
| Breakout · Wed | 0 | −0.15 | 0 | +0.41 | +1.77 | +0.41 | +2.44 |
| Breakout · Thu | 0 | +2.04 | +0.41 | −0.15 | −0.15 | −0.07 | +2.08 |
| Breakout · Fri | −0.15 | +0.48 | +1.44 | −0.15 | −0.07 | −0.07 | +1.48 |
| # of profitable accounts | 3/15 | 9/15 | 4/15 | 5/15 | 4/15 | 4/15 | 13/15 |
| Total | +1.51 | +9.73 | +1.81 | +4.43 | +3.68 | +1.33 | +22.49 |
For a single account in a single year, the result is almost always "a small loss the size of the fee" or "zero." Out of 90 account-years, 50 were losses, 11 were zero, and only 29 were profitable. In any given year, only 3–5 out of the 15 accounts are profitable, and in 2026 as many as 11 out of 15 accounts are in the red.
Yet the total is profitable in all 6 years. The profit from a small number of winning accounts covers the fees of the rest, every single year. This is what diversification really is — structurally close to holding 15 lottery tickets. If you only hold one, a year where it doesn't hit is a losing year.
Bollinger · Thu lost money in all 6 years; so did Breakout · Mon. It's a losing strategy, so accounts that never hit are exactly what you'd expect. Even so, the bundled side never suffers for it.
Correlation is low, but "number of units" matters more
For diversification to work, the P&L of each account needs to move independently of the others. We measured correlation using weekly P&L (in R).
| Pairing | Average correlation |
|---|---|
| All 15-account pairs (105 combos) | −0.02 (min −0.49, max +0.19) |
| Same strategy, different weekday | +0.006 |
| Same weekday, different strategy | −0.129 |
| 5 accounts (by weekday), pairwise | +0.012 |
| 3 accounts (by strategy), pairwise | −0.153 |
Splitting by weekday gives near-zero correlation. Splitting by strategy gives negative correlation (trend-following breakout and mean-reverting Bollinger point opposite ways on the same day).
Yet the 3-account split (by strategy), which has the lowest correlation, had 2 losing years, while the 5-account split (by weekday), whose correlation is near zero, had none. The number of units matters more than how low the correlation is. With only 3 units, the probability that "all of them miss at once" is still fairly high; once you get to 5 or more, there's consistently someone who hits every year.
Breaking down the 15 accounts: by strategy and by symbol
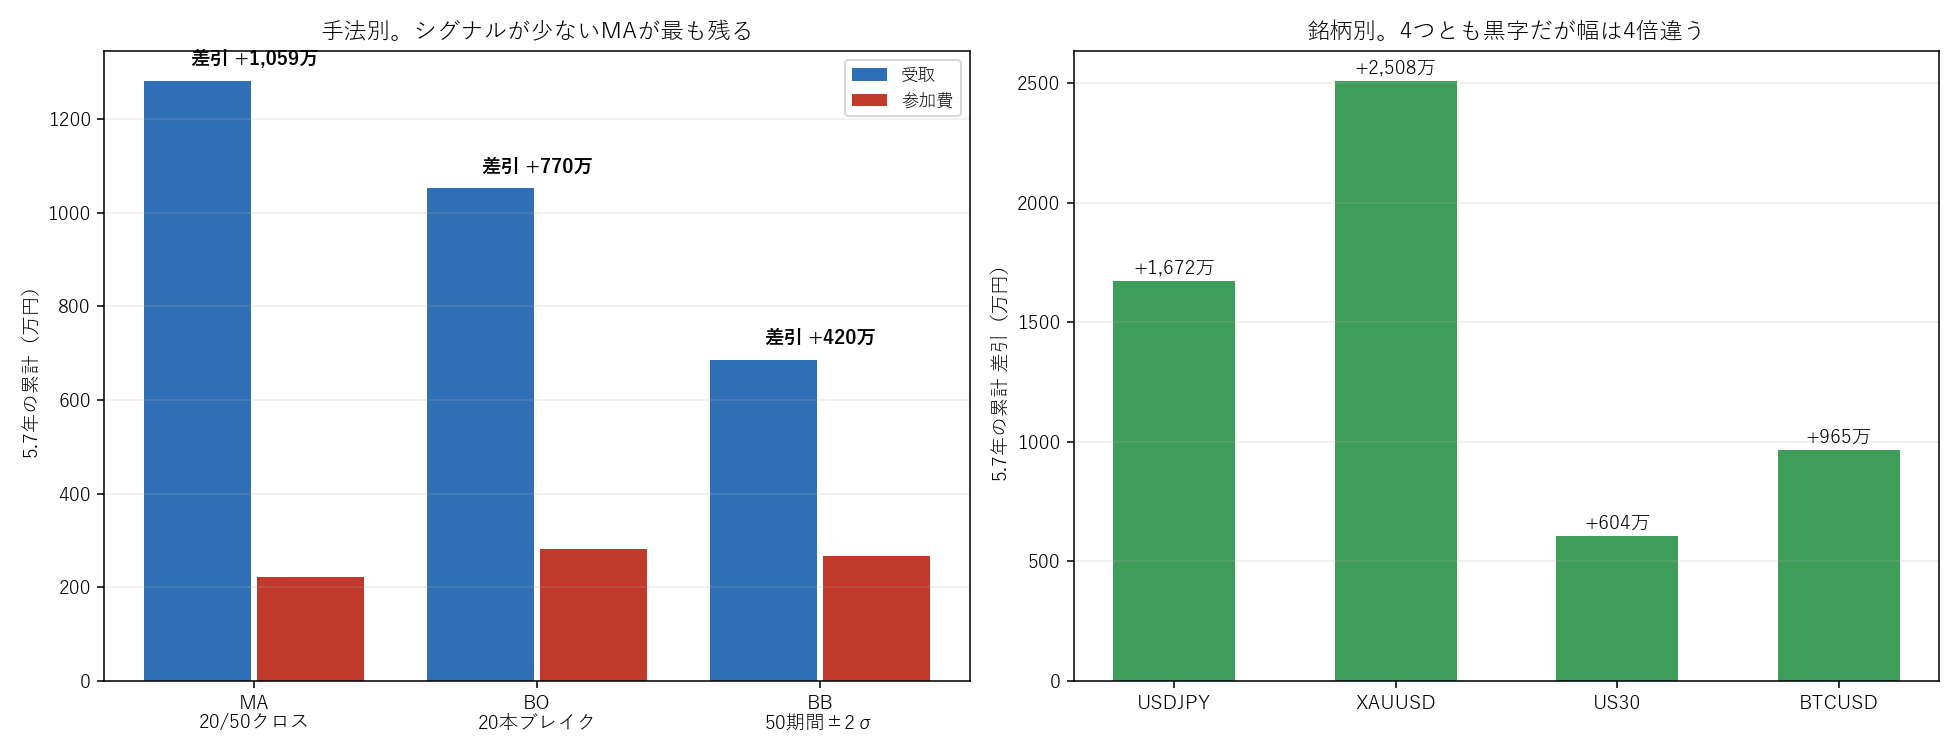
| Strategy (sum of 5 weekdays) | Trades | Blowups | Payouts | Fees | Net |
|---|---|---|---|---|---|
| MA cross | 1,280 | 30 | ¥12.81M | −¥2.22M | +¥10.59M |
| Breakout | 1,484 | 38 | ¥10.52M | −¥2.81M | +¥7.70M |
| Bollinger mean reversion | 1,425 | 36 | ¥6.86M | −¥2.66M | +¥4.20M |
The MA cross, which generated the fewest signals, came out on top. Of the 3 strategies it had the expectancy closest to zero (−0.026), so the strategy that lost the least ended up on top.
By symbol, all 4 were profitable: gold +¥25.08M, USDJPY +¥16.72M, BTCUSD +¥9.65M, US30 +¥6.04M — a 4x spread between the best and worst.
Splitting into first half and second half
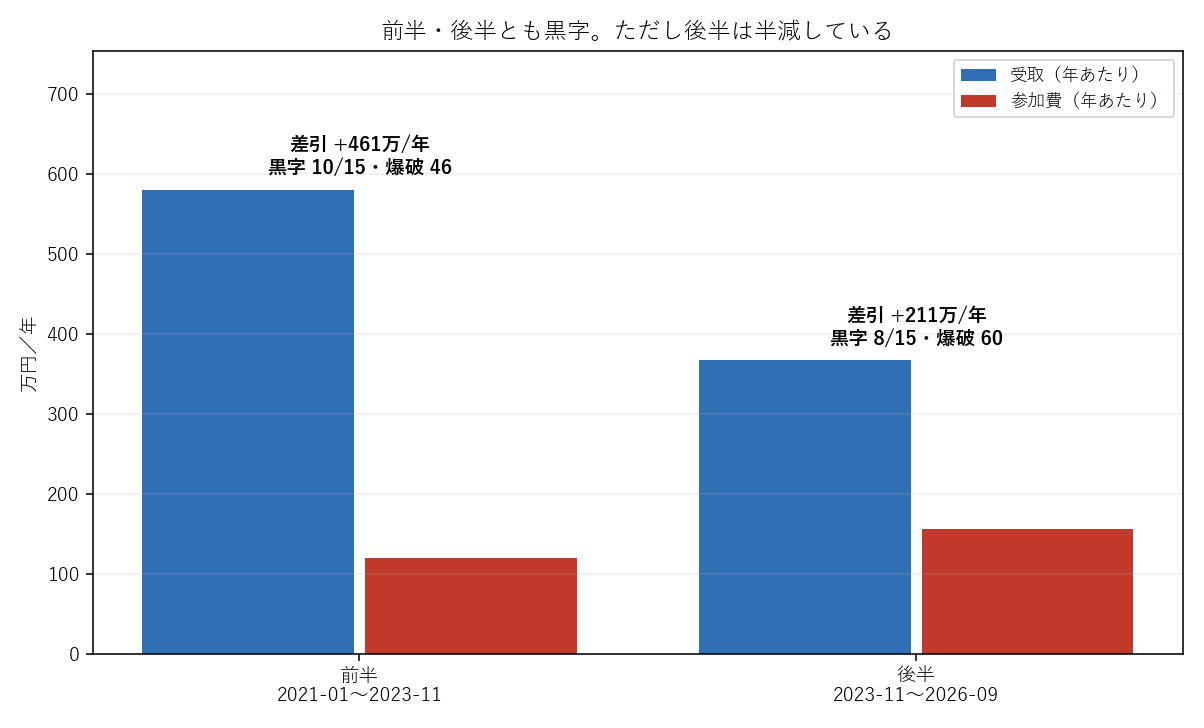
| Period (15 accounts) | Blowups | Net | Per year | Profitable accounts |
|---|---|---|---|---|
| First half, 2021-01 to 2023-11 | 46 | +¥13.13M | +¥4.61M | 10/15 |
| Second half, 2023-11 to 2026-09 | 60 | +¥6.02M | +¥2.11M | 8/15 |
Both halves are profitable, but the second half is roughly half of the first. Since the strategy's expectancy is negative, the profit is coming from the prop-firm structure — and that structure doesn't go away, but the dollar amount moves with market conditions. "+¥3.95M/year" is an average — you should assume that bad periods run about half of that.
A small edge makes it soar. A small deficit sinks it
Up to this point we held "no edge" fixed. Now, keeping the container exactly the same, we vary only the strategy's edge. We randomly flip the sign of losing trades to raise the win rate, and flip winning trades to lower it — averaged over 20 random draws.
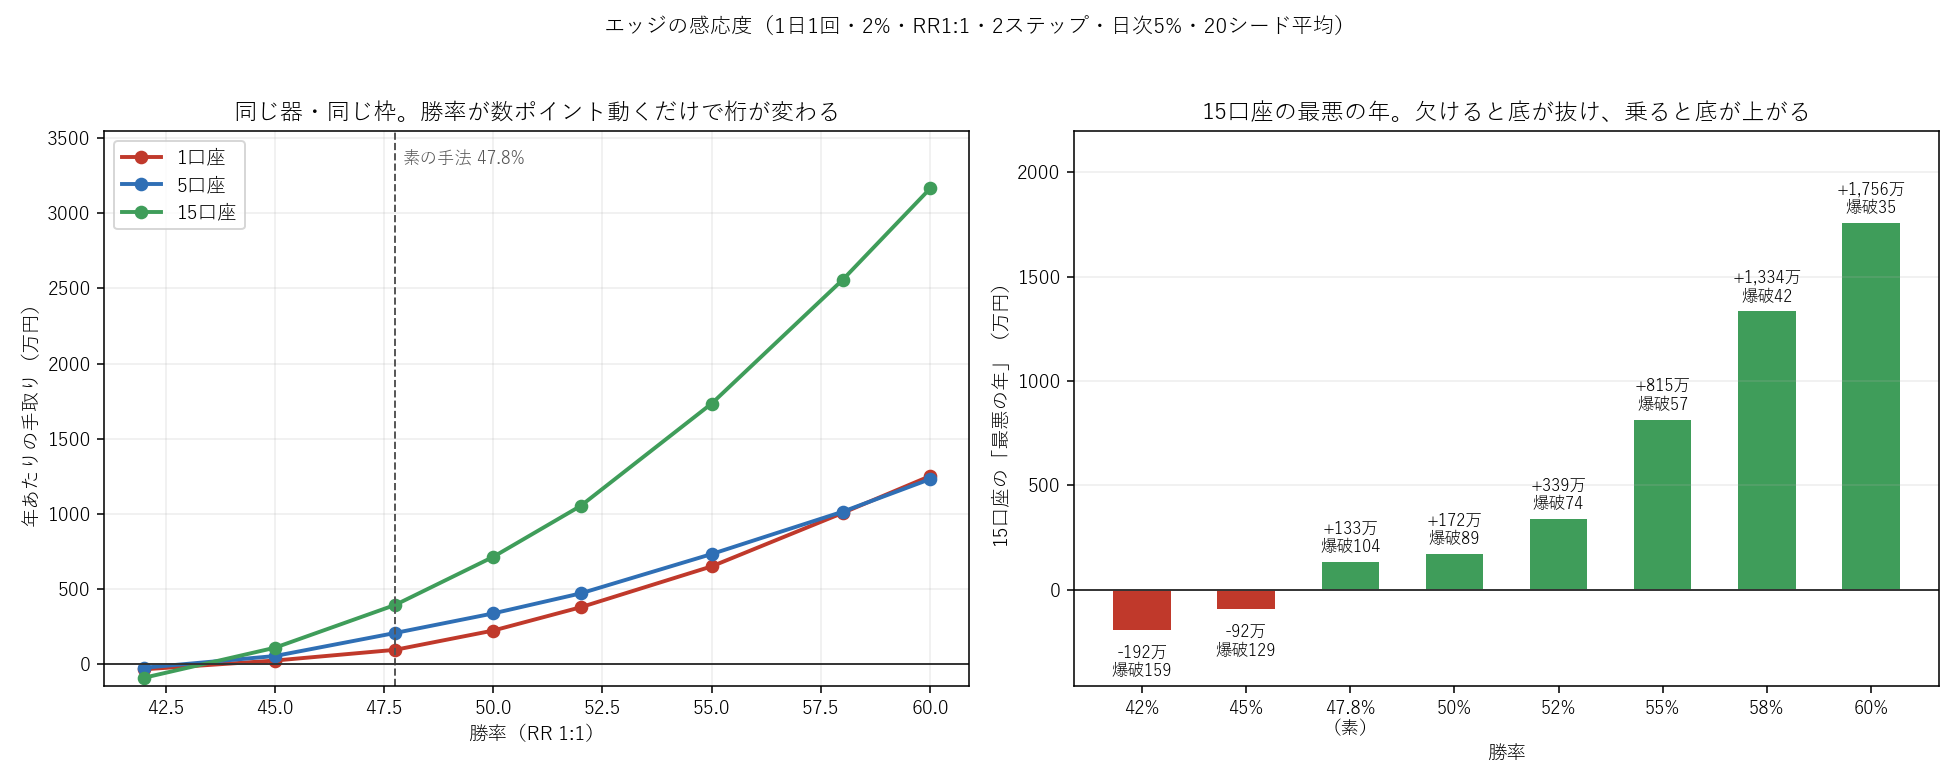
| Win rate | Expectancy | 15 accounts, per year | Worst year | Losing years | Blowups | Per account, per year |
|---|---|---|---|---|---|---|
| 42.0% | −0.16R | −¥900K | −¥1.92M | 5.3/6 | 159 | −¥340K |
| 45.0% | −0.10R | +¥1.10M | −¥920K | 2.1/6 | 129 | +¥250K |
| 47.8% (raw) | −0.045R | +¥3.95M | +¥1.33M | 0/6 | 104 | +¥960K |
| 50.0% | 0 | +¥7.14M | +¥1.72M | 0/6 | 89 | +¥2.24M |
| 52.0% | +0.04R | +¥10.53M | +¥3.39M | 0/6 | 74 | +¥3.79M |
| 55.0% | +0.10R | +¥17.34M | +¥8.15M | 0/6 | 57 | +¥6.51M |
| 58.0% | +0.16R | +¥25.58M | +¥13.34M | 0/6 | 42 | +¥10.07M |
| 60.0% | +0.20R | +¥31.64M | +¥17.56M | 0/6 | 35 | +¥12.52M |
Moving up makes it soar. At 50% — just canceling out the spread cost — it's already 1.8x (+¥7.14M). At 52%, i.e. winning just one extra trade out of every 24, it's 2.7x. At 55%, it's 4.4x at +¥17.34M, with even the worst year at +¥8.15M. The downside stays capped at the fee, while only the upside grows with edge × slots. Blowups also drop from 104 to 57, so the fee side shrinks in tandem.
Moving down makes it sink. Dropping just 2.8 points from the raw rate to 45% turns it into +¥1.10M with 2 losing years; at 42% it's −¥900K/year with 5 out of 6 years in the red. The shortfall doesn't need to be large — paying just an extra 5% of the stop-loss distance per trade (0.1% of the account) is enough to drop you to the 45% row. "Mistakes" like slippage, widened spreads, or a single rule-violation forfeiture accumulate in this direction. Over 5.7 years, the gap between the raw rate and 45% is ¥16M.
One more thing: the more edge you have, the less diversification matters. At 60%, 1 account (+¥12.52M) and 5 accounts (+¥12.32M) are nearly identical — the 15-account version comes out ahead only because it has 3.1x the trade count. Diversification does its work in the thin-edge zone; once you have real edge, it becomes a question of slots (number of accounts × once-a-day).
What this tells us
Diversification doesn't create profit. It erases the bad years. All 4 splits ended up profitable over the full run, and that comes from the prop-firm structure, not the strategy. What the split changed was whether losing years occurred.
Losing years disappeared at 5 accounts or more. Individual accounts lose money half the time, yet bundled together, something hits every single year and covers the fees. With only 3 accounts, there are still years where everything misses at once.
More accounts also means more slots. 15 accounts nets 4x the P&L of 1 account, but per account it's only a quarter as much. The absolute number is the effect of more slots; the flatness is the effect of diversification. Don't conflate the two.
The flattest was 5 accounts (by weekday); the biggest earner was 15 accounts (strategy × weekday). Which one to pick depends on how much fee capital you can keep cycling through.
And a few points of edge move the whole thing by an order of magnitude. With the exact same container, a 55% win rate nets ¥17.34M/year, while 45% nets ¥1.1M/year with losing years back in the picture. Diversification only firms up the floor of the container — whether you get a real upside is decided by edge and slots. Put another way: losing just a few points to slippage or extra costs can swing the long-run result by tens of millions of yen.
FAQ
Q. Why is "once a day" a fixed assumption here?
Because with only one 2% trade per day, you physically can't reach a 5% daily loss limit. Remove this assumption and you're no longer measuring diversification — you're measuring daily drawdown risk. For reference, letting a single account open trades any number of times per day gave −¥710K/year with 1 simultaneous position (102 blowups, 76 from daily DD) and −¥2.45M/year with 3 simultaneous positions (196 blowups, 178 from daily DD). Sizing that can't reach the daily DD limit is a prerequisite for even measuring diversification.
Q. Which is better, 5 accounts or 15 accounts?
15 accounts wins on absolute net; 5 accounts wins on per-account efficiency and flatness. 5 accounts ranges from a worst year of +¥940K to a best year of +¥3.06M, a 3.3x spread over 6 years; 15 accounts ranges from +¥1.33M to +¥9.73M, a 7.3x spread. If you can cycle roughly ¥1.35M/year in fees (15 accounts × ¥74,000 × 1.2 turns), go with 15; if not, go with 5.
Q. The 3-account split (by strategy) has the lowest correlation — why does it still have losing years?
Because it only has 3 units. A correlation of −0.15 is low, but there are still years (2023) where all 3 miss at once. Once you get to 5 or more units, the probability of "everything missing" drops, and there's consistently someone who hits every year. The effectiveness of diversification is driven more by the number of units than by correlation — that's a side finding of this backtest.
Q. What happens if the challenge fee is discounted?
The 15-account fee total over 5.7 years is ¥7.7M. A 15% coupon saves ¥1.16M; a 20% coupon saves ¥1.54M, flowing straight into the net. Annualized, that's ¥200K–¥270K. The unit price of the fee has a more direct impact on the net than which strategy is "better."
Q. Would picking a better strategy improve results more?
Yes. As shown in the sensitivity section, just a few points of win rate improvement doubles and redoubles the annual figure. That said, this article deliberately excluded strategy selection. Deciding "let's use only the MA cross" is something you can only know after seeing the results — that's hindsight. What changes when you just split accounts, without picking a strategy, is the question this article set out to answer.
Assumptions and limitations of this backtest
- This is real historical data, not a Monte Carlo simulation. January 2021 – September 2026, built from MT5's M5 data compressed into H1. Signals are on H1; stop-loss/take-profit hits are checked on the 5-minute chart (when both are touched on the same bar, the stop-loss is assumed to trigger first, as the conservative case)
- Point size is read from MT5's
SYMBOL_POINT. Based on the price tick size, this appears to be off by 74x for BTCUSD and 6x for gold, which inflates the spread by that same factor. Anyone running a similar backtest should be sure to use the exchange's official specification values - "Once a day" applies per account. The 15-account version opens up to 15 trades a day combined, so this is diversification in the sense of "adding more slots," not "splitting the same capital." Per-account figures are included alongside the totals in the tables above
- Consistency rules, best-day rules, payout fees, and KYC/purchase waiting periods are not modeled. We freely allow all 104 re-buys (across 15 accounts) with no restriction, but real firms scrutinize repeatedly re-buying the same account. This is a significant limitation
- The fee is fixed at ¥74,000 per attempt. In reality this varies by firm and account size
- The account is fixed to a single configuration: $100,000, 2-Step, max DD 10% static, daily 5%, profit split 80%. Results would differ at firms with trailing drawdowns or firms where the breach line rises after the first payout (e.g. E8 Markets)
- Of the 4 symbols, the index and BTC both rose substantially over this period. Since we trade both directions, this isn't a long-only bias, but it does depend on the volatility regime
- The edge sensitivity analysis is an artificial manipulation. It works by randomly flipping the sign of actual losing (or winning) trades to shift the win rate — it is not the distribution of any real strategy. The direction of the effect (convex upside, fragile downside) is trustworthy since it comes from the structure of the container, but the exact figures per row are only indicative
- The 1-account and 3-account cases each only have a single path (or 3 paths). "The 1-account version had 1 losing year" simply means that's what happened to occur over this particular 5.7-year stretch — it isn't a probability. With 250–1,350 trades per account, the rankings could shuffle within the margin of error
Related articles
Written by
Hosono P | the prop firm strategist
I buy challenges with my own money and record everything through to the payout. Recorded payouts: ¥6.1M in total from Fintokei, Fundora and Funded7, plus $4,776 from The5ers (as of September 2026). Author of the semi-discretionary EA "ELDRA".