Mindless Prop Firm Spam vs. a Serious Own-Capital Trader: We Tested Which Wins With the Same Cash, Using Real Data
※ This article presents the results of a Monte Carlo backtest. It does not guarantee future performance and is not investment advice. Assumptions and limitations of the backtest are stated at the end.
There's a common debate:
- A: Someone who mindlessly buys a pile of prop firm challenges and runs a different unrelated strategy on every account
- B: A trader trading their own money, relying purely on skill
Which one makes more money? We tested it with the same cash, the same strategies, and the same market.
Conclusion: with small capital, A wins decisively — but not because of leverage
$10,000 in starting capital, over one year.
| A: Prop ($500 × 20 accounts) | B: Own capital (trading $10,000) | |
|---|---|---|
| Expected assets after 1 year | $20,356 (2.04x) | $10,157 (1.02x) |
| Median | $13,637 | $10,142 |
| Probability of ending in profit | 59.3% | 63.1% |
A 2x gap in expected value. And this isn't because B is worse at trading. Both A and B pick from exactly the same 40 strategies. Skill is identical.
Here's the important part: even if B raises leverage all the way to 60x, they still can't catch A. In other words, the gap isn't about leverage at all.
How we compared them
Using real prices from July 2010 through September 2026, we applied 5 standard strategies (MA cross / Bollinger mean reversion / Donchian breakout / RSI mean reversion / momentum) to 8 symbols (gold, Nasdaq, S&P 500, Dow, crude oil, USDJPY, EURUSD, silver), producing 40 strategies. Of these 40, 25 were profitable and 15 were losers — a realistic mix.
Both A and B use this exact same set of 40 strategies.
- A … buys as many $500 challenges as they can afford and assigns each one to a different strategy. Every year, they re-buy as many accounts as their cash allows (capped at 40 accounts)
- B … holds the same 10 strategies at equal weight. Zero fees, keeps 100% of profits, but also bears 100% of losses
We ran 3,000 simulations, each with a randomly chosen real calendar start date. Real market quirks and real correlations between strategies carry straight through.
Finding 1: A wins because losses are capped
Let's give B leverage. If we raise leverage on the $10,000, can B catch up to A's $20,356?
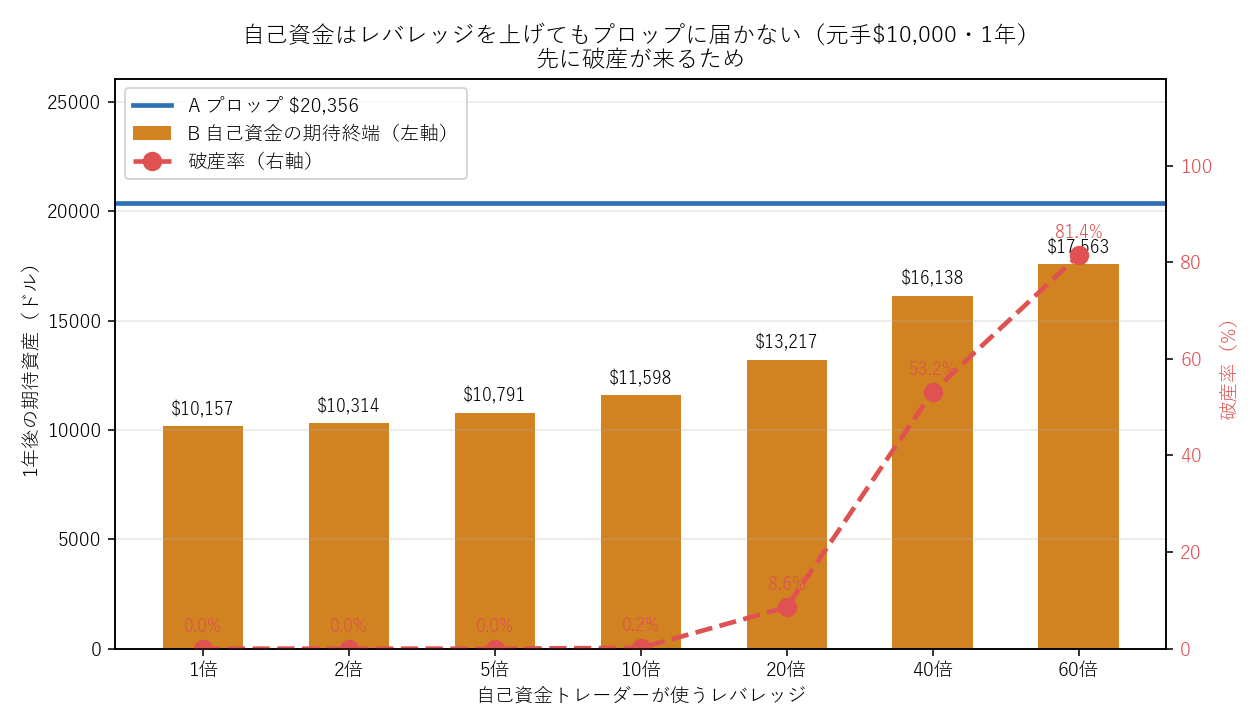
| B's leverage | Expected assets after 1 year | Bust rate |
|---|---|---|
| 1x | $10,157 | 0.0% |
| 5x | $10,791 | 0.0% |
| 10x | $11,598 | 0.2% |
| 20x | $13,217 | 8.6% |
| 40x | $16,138 | 53.2% |
| 60x | $17,563 | 81.4% |
| A (Prop) | $20,356 | — |
Even at 60x, B can't catch up. And the bust rate at that point is 81.4%.
The reason is clear: once B's losses cross a certain line, there's no coming back. Higher leverage raises expected value, but it also raises the "probability of dying along the way." An account that's dead can't participate in the subsequent upside, so the higher expected value never gets realized.
A, on the other hand, has losses on any single account capped at the $500 fee. No matter how badly the market beats them up, they only lose $500. But the upside can still run in a $100K container.
In other words, what prop firms are really selling isn't leverage — it's a cap on losses. You can create leverage yourself with your own capital, but you can't buy a loss cap on your own.
That said, this cap only matters for a certain kind of trader. We'll get to that next.
Finding 2: not enough units, and it's just a lottery ticket
That said, this isn't a story that simply ends with "prop wins, full stop." If your starting capital is small, A ends up in a rough spot.
With $2,500 in starting capital (enough for only 5 accounts):
| 1 year | 3 years | |
|---|---|---|
| Expected assets | $5,084 (2.03x) | $15,496 (6.20x) |
| Median | $496 | $56 |
| Probability of ending in profit | 41.3% | 32.1% |
Expected value is 6x, but the median is $56.
This is a state where "a rare, huge win pulls the average up, while what most people actually experience is close to a total loss." Over 3 years, 2 out of 3 attempts end up losing almost the entire stake.
At $10,000 (20 accounts), the median flips positive: $13,637 (1 year) / $31,879 (3 years). While you don't have enough units, prop is just a lottery ticket with positive expected value.
This echoes our earlier backtest: it all comes down to one point — diversification only works if you have enough units.
Finding 3: as capital grows, A's edge disappears
This is the most surprising part.
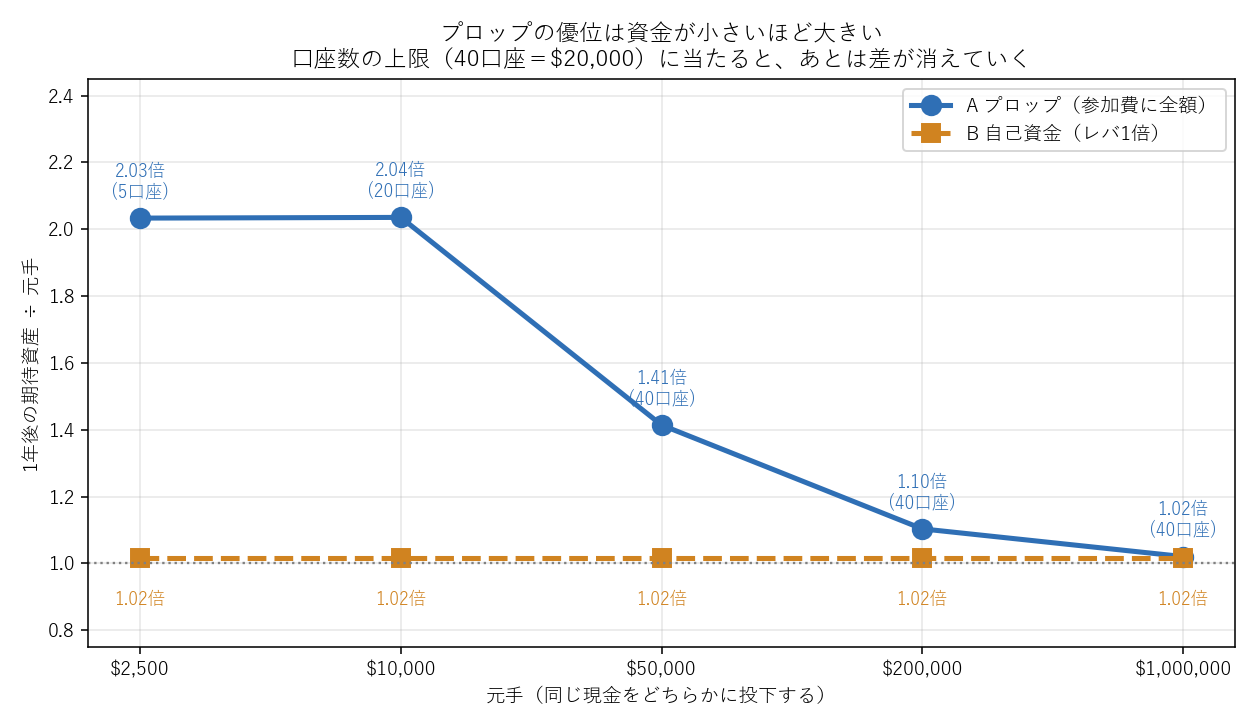
| Starting capital | Accounts affordable | A's multiple | B's multiple |
|---|---|---|---|
| $2,500 | 5 | 2.03x | 1.02x |
| $10,000 | 20 | 2.04x | 1.02x |
| $50,000 | 40 (cap) | 1.41x | 1.02x |
| $200,000 | 40 (cap) | 1.10x | 1.02x |
| $1,000,000 | 40 (cap) | 1.02x | 1.02x |
At $1,000,000, the two are nearly identical.
The reason is simple: there's a ceiling on how much money you can deploy into prop. Realistically, you can hold at most around 40 challenge accounts, so $500 × 40 = only $20,000 is actually put to work. The remaining $980,000 just sits idle in cash.
B has no such ceiling. So as capital grows, A's multiple converges toward 1.0.
The numbers make it clear: prop is a mechanism built for people with small capital.
Finding 4: matching prop with your own capital requires a Sharpe ratio of 1.46
So what if B were genuinely a serious, skilled trader? We measured how much skill it takes to catch up with A.
From here on we compare using the median, since A has strong lottery-ticket characteristics and comparing averages alone would misrepresent reality. For someone who only gets one shot, the median is what they'll actually experience.
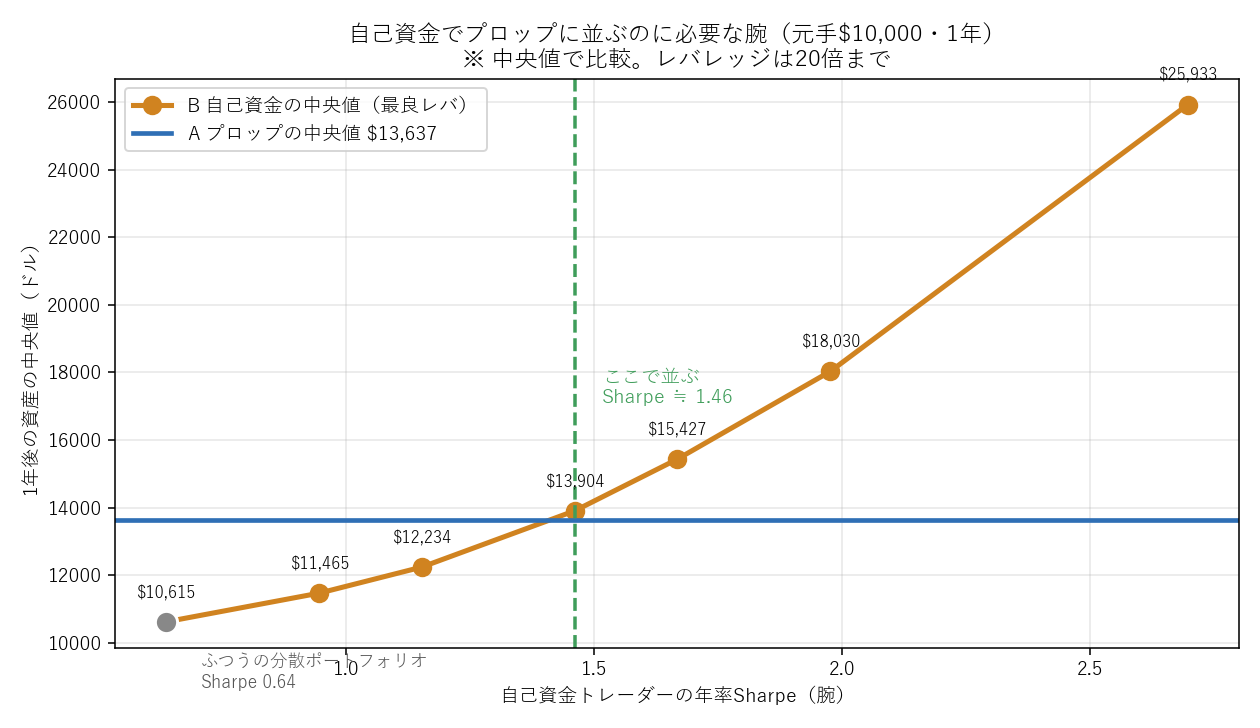
| B's annualized Sharpe ratio | Optimal leverage | Median after 1 year | Verdict |
|---|---|---|---|
| 0.64 (a typical diversified portfolio) | 8x | $10,615 | Falls short |
| 0.95 | 12x | $11,465 | Falls short |
| 1.15 | 16x | $12,234 | Falls short |
| 1.46 | 20x | $13,904 | ★ Beats A |
| 1.67 | 20x | $15,427 | Beats A |
| 1.98 | 20x | $18,030 | Beats A |
※ A's (prop) median is $13,637.
The breakeven point was an annualized Sharpe ratio of 1.46.
The Sharpe ratio measures "how much return you generated relative to risk." A rough guide:
Below 0.5 … a typical retail traderAround 1.0 … quite goodAround 1.5 … good territory even for a professional fund2.0 and up … top-tierThe 10-strategy portfolio built from this backtest's 40 strategies had a Sharpe of 0.64. A matches a trader with a Sharpe of 1.46 while staying at this ordinary skill level.
Put differently — prop is producing the same effect as "doubling your skill," purely through structure.
Back to Finding 1: getting wiped out isn't unique to "own capital"
"Own capital can be wiped out by a single crash, while prop only costs you the fee" — that's the intuitive assumption. When we measured it, that wasn't quite right.
We introduced a shock once a year: a single random symbol jumps 4% (modeling intervention or a flash crash). A real shock doesn't hit the whole market in the same direction — it moves one symbol, and whether that helps or hurts each strategy depends on the direction of its position. Long strategies lose, short strategies gain.
| Shock size | A (prop) median | B (own capital) median |
|---|---|---|
| None | $13,637 | $18,030 |
| 4% | $13,542 | $18,017 |
| 10% | $13,984 | $17,602 |
Even a 10% shock every single year barely moves either result. Because the shock hits a diversified set of strategies from both directions, and the effects largely cancel out.
What actually mattered was the number of diversified strategies
So what determines bust risk? We took an own-capital trader at 20x leverage and varied only the number of strategies they hold.
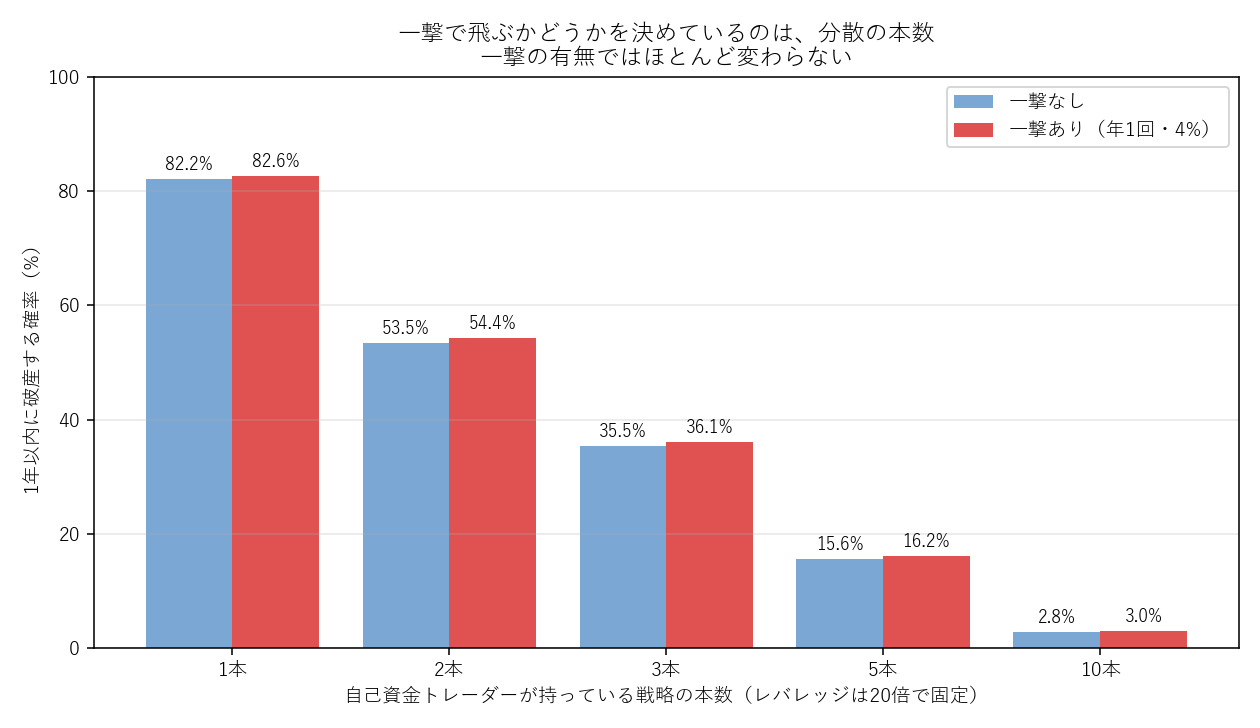
| # of strategies | Bust rate, no shock | Bust rate, with shock | Worst single day that year |
|---|---|---|---|
| 1 | 82.2% | 82.6% | −67.8% |
| 2 | 53.5% | 54.4% | −43.4% |
| 3 | 35.5% | 36.1% | −36.2% |
| 5 | 15.6% | 16.2% | −28.0% |
| 10 | 2.8% | 3.0% | −20.6% |
Reading down the column, it drops from 82% to 3%. Reading across, it barely moves — only 0.4 points.
In other words, someone running 20x leverage on a single strategy goes bust even without a shock. Normal market movement alone is enough. The shock is just the final blow — it isn't the cause.
Conversely, if you're diversified across 10 strategies, the bust rate at that same 20x leverage is 3%. A shock doesn't change that.
※ Testing the worst-case scenario — where the shock is rigged to always land against your position — gives an 89.4% bust rate for 1 strategy and 44.4% for 10. Even here, the number of strategies still makes roughly a 2x difference.
So Finding 1 needs to be restated
A hard cap on losses only has decisive value for people who aren't diversified.
- If you're concentrated in 1 strategy … for own capital, going bust isn't a matter of probability — it's a matter of time. A capped-loss prop account is overwhelmingly better
- If you're diversified across 10 strategies … even own capital at 20x leverage has only a 3% bust rate. In this case, the prop cap is mostly a wasted insurance premium — if you have genuine skill, B is the stronger choice (median $18,030 vs. $13,637)
The outcome is determined by "whether you're diversified" before it's ever determined by "prop vs. own capital."
Something we also tested that made no difference
We suspected that "periods where the edge disappears" would hurt own-capital more, and tested it — it made no difference.
Keeping the average of alpha over time fixed while switching edge on/off every 60 days left the Sharpe ratio needed to match prop unchanged at 1.46 (if anything, the intermittent version had a slightly higher median). The edge disappearing periodically, by itself, didn't increase bust risk. What increases bust risk is not cutting leverage during those quiet periods.
So which one is it, really?
The answer depends on capital size.
Under $50,000, prop is the clear choice. The leverage subsidy is too big to pass up. Unless you have a Sharpe ratio around 1.5, matching prop with your own capital is impossible. That said, unless you can buy at least 10–20 accounts, it's just a lottery ticket with positive expected value. 5 accounts on $2,500 isn't enough.
Above $200,000, do both. Buy prop up to the account cap (roughly $20,000), and trade the rest as your own capital. The prop allocation is simply "the most efficient use of $20,000" — beyond that, it doesn't scale.
At $1,000,000, your main battlefield is your own capital. Prop only accounts for 2% of the total, so sharpening your skill matters more.
What this backtest doesn't cover
So the numbers aren't taken at face value, we're stating clearly here that several factors favoring B are missing.
① We assume zero contract/regulatory risk
In reality, prop firms come with rule changes, payout refusals, and firm shutdowns. On this site, we've covered cases where EAs were suddenly banned, where Trustpilot ratings were suspended, and where a service was paused entirely. Own capital has none of this risk. This is a major advantage for B that isn't reflected in these numbers.
② Compounding works differently
A's accounts get reset, so compounding doesn't carry through. B's does. The longer the horizon, the more this favors B. This backtest only goes out to 3 years.
③ Taxes are ignored
④ The workload is ignored
Managing 40 accounts is a job in itself. You have to track rules, payout cycles, and remaining drawdown room across all of them.
Other assumptions
- This is a daily-bar, one-trade-per-day model. It doesn't apply to intraday strategies that open and close within the day
- Each strategy's volatility is normalized to 0.8%
- Minimum trading days, consistency rules, and payout cycles are not modeled
- "Bust" for own capital is defined as the point where the account has dropped to 20% of the original capital
- The account cap is set at 40. Changing this would also shift the crossover point found in Finding 3
- The period runs from 2010 to 2026. Anything that didn't happen during this period wasn't tested for
The scripts are available for download. sim-prop-vs-own-capital.py / lib_waves.py / fetch_wave_data.py (Python + NumPy + pandas + yfinance, fixed random seed). Change MAX_ACCOUNTS or FEE to recalculate under your own assumptions.
FAQ
Q. Why does prop make more money?
Because losses are capped at the fee. Pay $500 and you get to use a $100K container — no matter how badly you lose, you only lose $500. The upside can run all the way up to the container's limit. But this cap only has decisive value for someone who isn't diversified (see "Back to Finding 1" above). If you're diversified across 10 strategies, even your own capital at 20x leverage had only a 3% bust rate. Raising leverage on your own capital doesn't achieve the same thing — the more you raise it, the higher the probability you go bust along the way and can't participate in the upside that follows. In this backtest, even 60x leverage couldn't catch up, and the bust rate there was 81.4%.
Q. How much starting capital do I need?
At least 10 accounts, ideally 20. For a $500 plan, that's $5,000–$10,000. At $2,500 (5 accounts), expected value is 2x but the median is $496 — most of what you'll actually experience is close to a total loss. Run it for 3 years and the median drops to $56. While you don't have enough units, it's just a lottery ticket with positive expected value.
Q. What should I do if I have a large amount of capital?
Buy prop up to the account cap, and trade the rest with your own capital. Realistically, the most you can deploy into prop is around $20,000 (40 accounts) — beyond that, it doesn't scale. In this backtest, at $1,000,000, A was at 1.02x and B was at 1.02x — practically tied. Think of the prop allocation as "the most efficient use of $20,000," and manage anything beyond that yourself.
Q. How much skill does it take to win with my own capital?
The breakeven point was an annualized Sharpe ratio of 1.46. That's "good territory even for a professional fund." The 10-strategy portfolio built from this backtest's 40 strategies had a Sharpe of 0.64, and at that skill level, even optimizing leverage couldn't catch up. Prop is producing a result equivalent to a Sharpe of 1.46, purely through structure, while the trader stays at an ordinary skill level.
Q. Isn't this backtest too favorable toward prop?
Yes, and several factors that favor B are missing. The biggest is contract/regulatory risk. Real prop firms come with rule changes, payout refusals, and shutdowns — own capital has none of that. Also missing: how compounding works (which favors B over the long run), taxes, and the workload of managing 40 accounts. Factoring these in would move the crossover point further in B's favor.
Q. Does "mindless diversification" actually hold up?
Assuming you have no edge, it's actually optimal. In this backtest, A simply picks randomly from 40 strategies — no symbol selection, no market view. Yet it still matches a trader with a Sharpe of 1.46. There are two conditions, though: the strategies must not be similar to each other, and you must have enough units. Line up similar strategies, or only buy 5 accounts, and this result won't reproduce. See Is diversification really a free lunch? for more detail.
Related articles
- Is diversification really a free lunch? Tested with 40 real-data strategies
- Challenge distillation: advancing only the survivors
- When should you change your prop account settings?
- Multiple accounts: "rotation diversification" beats "full mirroring"
- Position sizing and lot calculation for prop firm accounts
Written by
Hosono P | the prop firm strategist
I buy challenges with my own money and record everything through to the payout. Recorded payouts: ¥6.1M in total from Fintokei, Fundora and Funded7, plus $4,776 from The5ers (as of September 2026). Author of the semi-discretionary EA "ELDRA".