Is Diversification Really a Free Lunch? Testing Challenge Distillation With 40 Real-Data Strategies
※ This article presents the results of a Monte Carlo test and does not guarantee future performance. It is not investment advice. The assumptions and limitations of the test are stated at the end.
"Diversification is the only free lunch in investing" — a famous line from Nobel laureate Harry Markowitz.
Does the same hold for prop firm challenges? This site's tests have so far used coin-flip (artificial random number) simulations, but this time we checked it by running actual strategies on actual price data.
The short answer: in prop firms, it's more than just a free lunch. But there's one condition attached, and most people go out of their way to break it themselves.
Conclusion
| Concentrated (10 accounts, 1 strategy) | Diversified (10 accounts, 10 strategies) | |
|---|---|---|
| Total-wipeout rate | 58.4% | 1.8% |
| At least 1 account reaches Funded | 23.8% | 89.7% |
| Probability of ending in profit | 14.6% | 51.4% |
| Expected net payout | +$6,141 | +$5,544 |
| Spread of outcomes (standard deviation) | $36,581 | $14,224 |
The number of accounts and the total fee are exactly the same. The only difference is "how many different strategies the 10 accounts were split across."
That alone cuts the total-wipeout rate to 1/32, while expected value drops by only about 10%.
How we tested this
Building 40 "waves" from real data
From July 2010 through September 2026, we ran 5 standard strategies against 8 symbols (gold, Nasdaq, S&P 500, Dow, crude oil, USD/JPY, EUR/USD, silver).
| Strategy | Description | Average Sharpe across 8 symbols |
|---|---|---|
| Momentum | Follows the sign of the 60-day return | 0.209 |
| Donchian breakout | Follows new 55-day highs/lows | 0.151 |
| Moving average cross | Position of the 20-day vs. 100-day line | 0.117 |
| Bollinger mean reversion | Reverses on a ±2σ touch | 0.052 |
| RSI mean reversion | Reverses at RSI 30/70 | 0.011 |
5 strategies x 8 symbols = 40 strategies (called "waves" below). Of the 40, 25 came out positive and 15 negative — a fairly realistic mix. The average Sharpe was 0.108, which is a very thin edge, roughly PF 1.02–1.04.
The implementation uses the previous day's close for signals and fills the next day (no peeking at future data), and deducts a round-trip cost of 2 basis points. Each wave has its daily volatility normalized to 0.8%, so "10% max drawdown" means the same thing across every wave.
Running them straight through a challenge
We assign one wave per account and run a 2-phase challenge ($100K, target 8% → 5%, max drawdown 10%, daily loss 5%, fee $500, profit split 80%) for 260 trading days.
Trials use a randomly chosen actual calendar start date, run 4,000 times. This way, the true correlation between waves and the real quirks of price action carry through unchanged — the decisive difference from artificial random numbers.
Finding 1: Concentration — adding accounts doesn't move the odds by a hair
This was the first shock.
| Accounts | Total fee | Total-wipeout rate | ≥1 reaches Funded | Profit rate |
|---|---|---|---|---|
| 1 account | $500 | 58.4% | 23.8% | 14.6% |
| 5 accounts | $2,500 | 58.4% | 23.8% | 14.6% |
| 10 accounts | $5,000 | 58.4% | 23.8% | 14.6% |
| 20 accounts | $10,000 | 58.4% | 23.8% | 14.6% |
Every number is identical. Not a single digit moves.
The reason is simple: if you run the same strategy over the same period, every account experiences exactly the same price action. When it wins, they all win; when it loses, they all die together. Paying $10,000 for 20 accounts just buys 20 copies of one account.
"Add more accounts and surely one will survive" simply does not hold when the contents are identical.
Finding 2: Just the number of splits cuts the wipeout rate by 32x
So we fixed the account count at 10 and only varied "how many separate strategies are used." The fee is always $5,000.
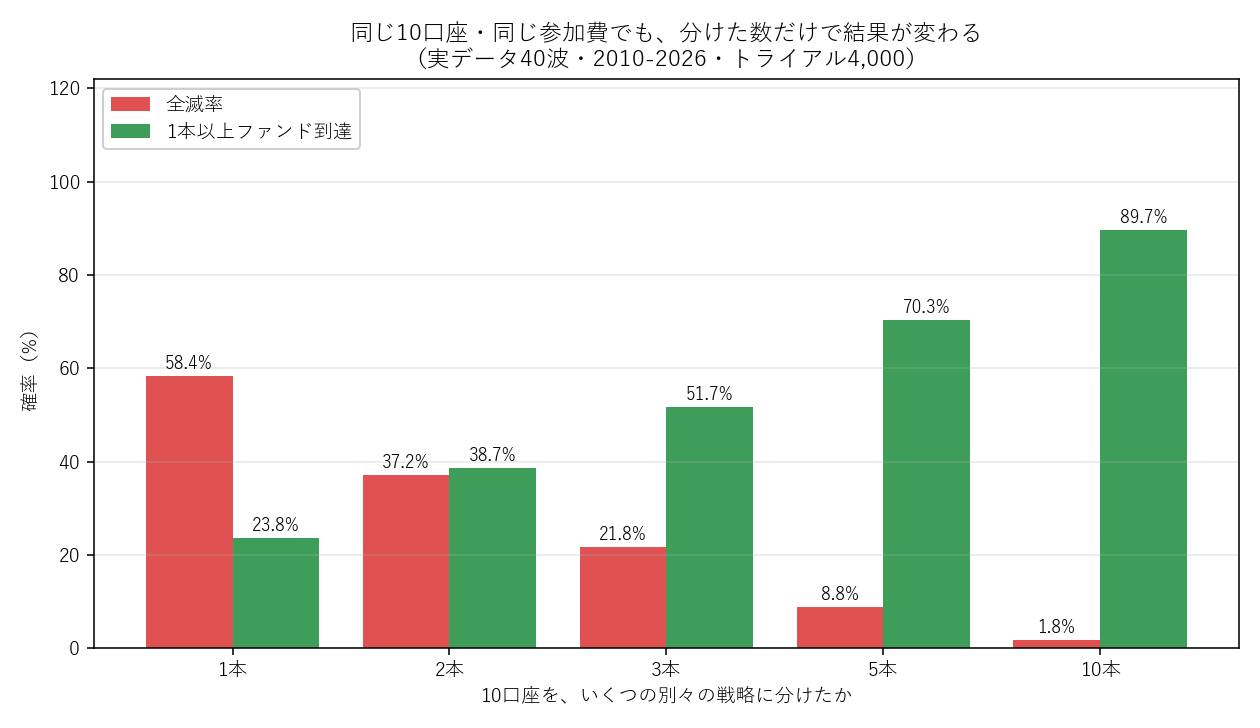
| Separate strategies | Total-wipeout rate | ≥1 reaches Funded | Profit rate | Std. dev. | Correlation between strategies |
|---|---|---|---|---|---|
| 1 (all the same) | 58.4% | 23.8% | 14.6% | $36,581 | 1.000 |
| 2 | 37.2% | 38.7% | 23.8% | $25,622 | 0.007 |
| 3 | 21.8% | 51.7% | 32.4% | $21,211 | 0.005 |
| 5 | 8.8% | 70.3% | 41.9% | $19,134 | 0.007 |
| 10 (all different) | 1.8% | 89.7% | 51.4% | $14,224 | 0.008 |
Just splitting into 2 drops the wipeout rate by 21 points. This is the most efficient single move. Going to 3, then 5, keeps helping, but the returns diminish gradually.
Finding 3: Expected value doesn't move. This is the free lunch
This is the crux of it. Given how much risk dropped, did profit go down too?
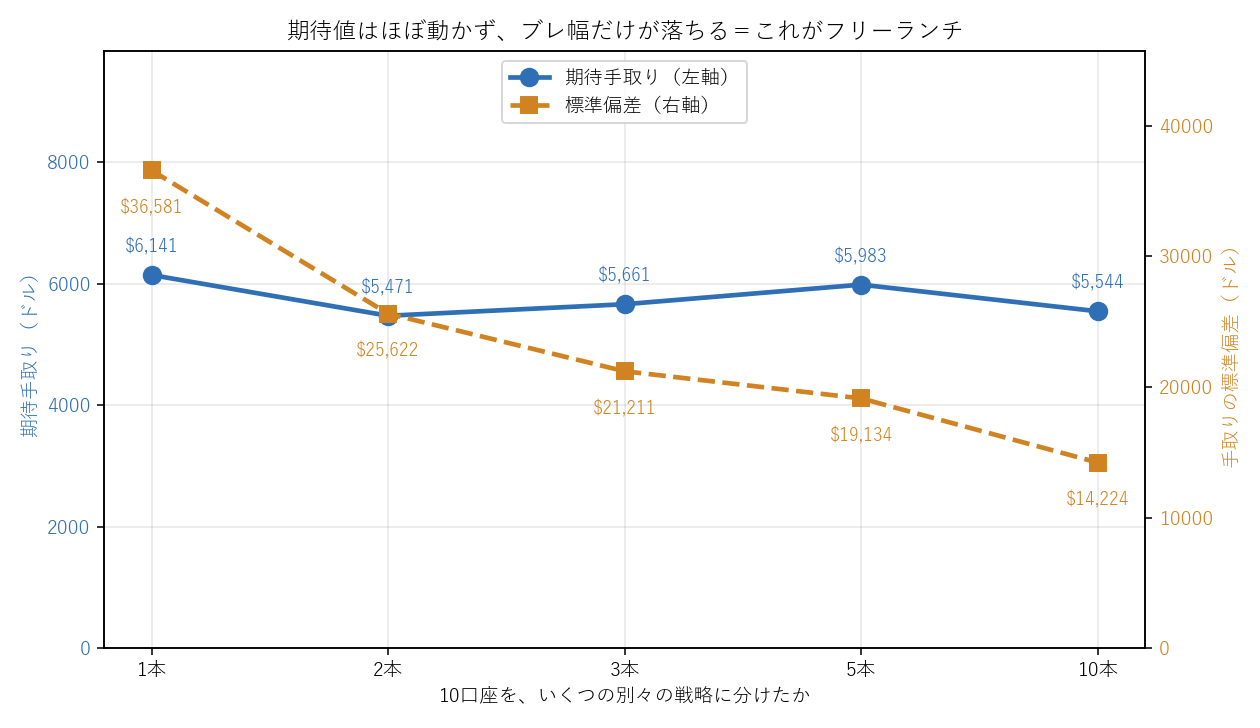
| Separate strategies | Expected net payout | Std. dev. |
|---|---|---|
| 1 | +$6,141 | $36,581 |
| 2 | +$5,471 | $25,622 |
| 3 | +$5,661 | $21,211 |
| 5 | +$5,983 | $19,134 |
| 10 | +$5,544 | $14,224 |
Expected net payout goes from $6,141 to $5,544 — essentially flat (it wobbles up and down with no clear trend). Meanwhile, standard deviation drops from $36,581 to $14,224 — down to 39%.
In other words, you're buying a 60% reduction in spread and a 32x reduction in total-wipeout rate for a 10% haircut on expected value.
This is the phenomenon called a "free lunch." Normally, if you want higher returns, you have to take on more risk. But diversification alone lets you cut risk while keeping returns almost unchanged. Free food.
In prop firms, it's an even better deal than free
In the world of stocks and mutual funds, the value of diversification stops at "same expected value, smaller swings." Prop firms make this even sweeter.
The reason is that drawdown acts as an absorbing wall. Once an account touches its max drawdown, it never comes back, no matter how much the market recovers afterward.
- With stocks, even a big drawdown can recover if you keep holding
- With prop firms, once you breach the line, that's game over, permanently
So a smaller spread directly lowers the probability of hitting that wall. In the table above, "at least 1 account reaches Funded" jumps from 23.8% to 89.7% — that's the effect. Diversification doesn't just lower risk; it nearly quadruples your win rate.
Finding 4: But it comes with a condition — "low correlation"
There's a reason these numbers came out so cleanly. The average correlation across the 40 waves in this test was only 0.007 (effectively zero).
"Correlation" measures how similarly two strategies move. 1.0 means identical movement, 0 means unrelated, and negative means moving in opposite directions.
Looking inside the 40 waves, they ranged widely — a maximum of 0.88 (running the same strategy on the S&P 500 and the Dow is nearly the same thing) and a minimum of −0.74 (running trend-following and mean-reversion on the same symbol moves in opposite directions) — averaging out to nearly zero.
How far does diversification stop working as correlation rises?
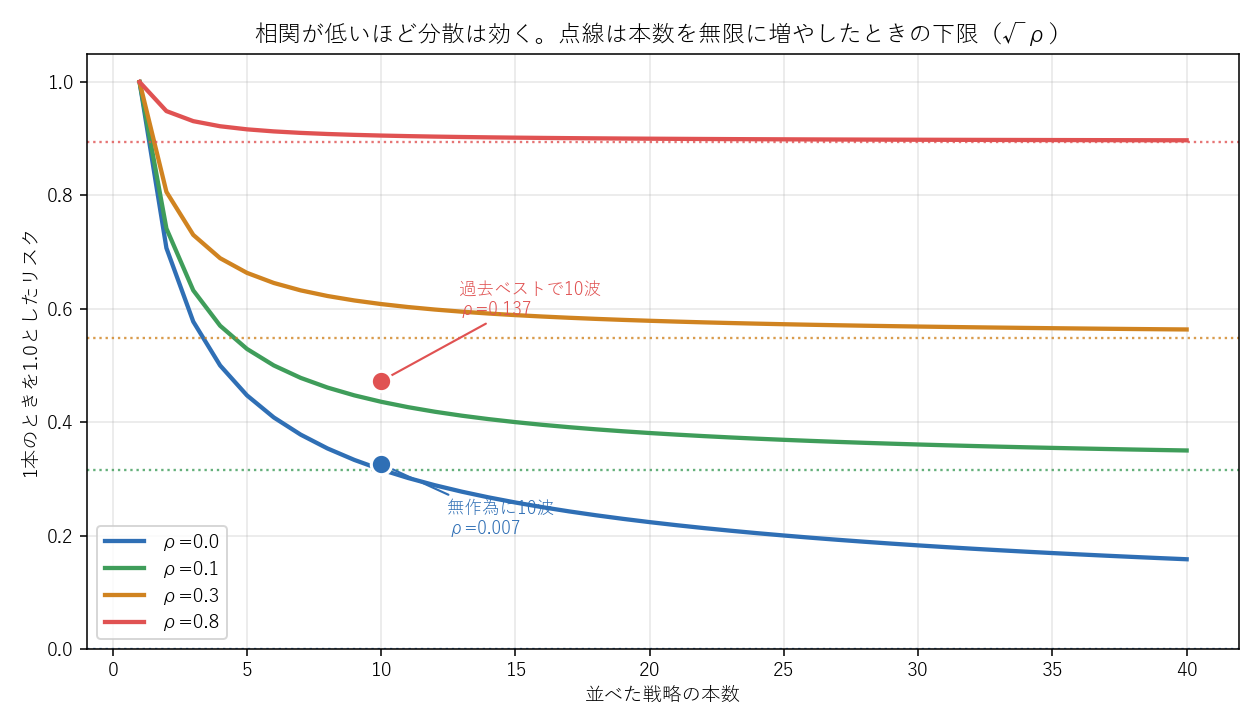
| Correlation ρ | 5 | 10 | 20 | 100 | Floor that no amount of adding can beat |
|---|---|---|---|---|---|
| 0.0 | 0.447 | 0.316 | 0.224 | 0.100 | 0.000 |
| 0.007 (this test) | 0.453 | 0.326 | 0.238 | 0.130 | 0.084 |
| 0.1 | 0.529 | 0.436 | 0.381 | 0.330 | 0.316 |
| 0.3 | 0.663 | 0.608 | 0.579 | 0.554 | 0.548 |
| 0.8 | 0.917 | 0.906 | 0.900 | 0.896 | 0.894 |
※ Values relative to risk = 1.0 for a single strategy. Theoretical value is √((1+(N−1)ρ)/N), floor is √ρ.
At correlation 0.8, lining up 100 strategies only brings risk down to 89.6%. Even with 10, it's 0.906. In other words, almost nothing happens.
Whether diversification works is determined by correlation, not by count. Lining up 10 similar things is no different from having just one.
Finding 5: "Picking the best-performing strategies" breaks diversification by itself
This was the most practically useful finding.
Normally, when picking multiple strategies, you'd think, "let's pick the ones that have performed well recently," right? We measured what happens when you do that.
| Number picked | Correlation when picked at random | Correlation when picking recent top performers |
|---|---|---|
| 5 | +0.003 | +0.209 |
| 10 | +0.010 | +0.137 |
| 20 | +0.007 | 0.054 |
The moment you select by performance, correlation jumps 20x to 70x.
The reason makes sense once you think about it: a strategy that's performed well recently is one that fit the recent market environment. Things that respond to similar environments naturally move similarly. In "a period when gold was strong," gold-related strategies dominate the top ranks; in "a trending market," trend-followers line up together.
This showed up directly in actual performance too. For 20 accounts:
| Selection method | Total-wipeout rate | Expected net payout | Profit rate |
|---|---|---|---|
| Diversified (20 chosen at random) | 0.1% | +$11,439 | 58.9% |
| Diversified (top 20 by performance) | 0.5% | +$8,150 | 54.0% |
Random selection won on every single metric. Selecting by performance meant the loss from higher correlation outweighed any edge from choosing "better" strategies.
When you gather things that "look good," you end up concentrated while thinking you're diversified. This is the easiest trap to fall into.
Finding 6: Concentration maximizes expected value alone — but you lose 80% of the time
To be fair, let's show the opposite result too. Looking purely at expected value, "putting everything on the single best-performing strategy" was actually the strongest.
Comparison at 20 accounts:
| Setup | Expected net payout | Profit rate | Total-wipeout rate | Std. dev. |
|---|---|---|---|---|
| Concentrated (20 accounts on the single best-performing strategy) | +$23,011 | 18.5% | 63.1% | $87,210 |
| Concentrated (20 accounts on a random single strategy) | +$12,282 | 14.6% | 58.4% | $73,162 |
| Diversified (20 chosen at random) | +$11,439 | 58.9% | 0.1% | $24,091 |
The expected value is double that of diversification. The phenomenon where a recently strong strategy tends to stay somewhat strong turned out to be real.
But the probability of ending in profit is only 18.5%. In other words, you lose 4 times out of 5. A rare, outsized win is just dragging the average up — in the vast majority of actual runs you experience, you're in the red.
This is the essence of the choice.
Concentrated … higher expected value, but loses in 80% of runsDiversified … half the expected value, but wins in 60% of runsIf you can repeat the bet many times, concentration is correct. But if your fee budget is finite, and a total wipeout means you can't buy the next attempt, you get knocked out before you ever reach the average. Since prop firm fees are finite in practice, diversification is the practical answer.
So, is diversification a free lunch?
Answer: yes, it's a free lunch — and an even better deal than in stocks. But it's neither "the only one" nor "unconditional."
Why it's a good deal
- You can cut the spread by 60% while barely touching expected value ($36,581 → $14,224)
- Because drawdown acts as an absorbing wall in prop firms, reduced spread by itself raises the probability of reaching your goal (23.8% → 89.7%)
- You can do this for the same fee — zero additional cost
Why it's not unconditional
- It only works when correlation is low. At correlation 0.8, lining up 100 strategies only reduces risk by 10%
- Selecting by performance raises correlation and cancels out the benefit itself (0.003 → 0.209)
- Expected value itself does not increase. Diversification isn't a tool for boosting profit — it's a tool for survival
And it's not "the only one." There are other things in prop firms you can get for free besides diversification: fee discounts, choosing plans with a good target-to-max-drawdown ratio, cutting lot size once you reach Funded. All of these reduce risk without cutting expected value.
That said, as this test shows, diversification is the single most powerful of them.
How to apply this in practice
① Don't line up accounts with identical settings
This is the biggest waste. Running the same strategy across 10 accounts is just copying one account 10 times — the odds don't move an inch.
② Splitting into just 2–3 captures most of the benefit
The total-wipeout rate goes 58.4% → 37.2% (2) → 21.8% (3), and the first few splits are where most of the effect comes from. Adding up to 10 helps further, but the value of just splitting into 2 is overwhelming on its own.
③ Pick things that are "different from each other" — not "strong"
Selecting from the top performers spikes correlation. Deliberately spread across different symbols, different logic, and different time windows. Mixing trend-following with mean-reversion is especially effective (this data included a pairing with correlation −0.74).
④ How far you can diversify is set by the rules
If you hold multiple accounts, some firms ban holding opposite positions across accounts. Running trend-following and mean-reversion on separate accounts at the same time can accidentally create an unintended hedge, so check whether the time windows overlap.
Limitations of this test
So you don't take the numbers at face value, here are the weaknesses, spelled out:
- This is a daily, one-trade-per-day model. It doesn't directly apply to intraday-only strategies or scalping
- Each strategy's volatility is normalized to 0.8%. In reality, volatility differs by strategy, so equalizing risk requires separate work
- Minimum trading days, consistency rules, and payout cycles are not implemented. These would work somewhat against the diversified side (more accounts means more to manage)
- The 40 strategies are 5 strategies x 8 symbols, so the variety of strategy types is limited. It includes related families (3 trend-following variants)
- Costs are a fixed round-trip of 2 basis points. Real spreads and slippage vary a lot by symbol and time of day
- The period is the 16 years from 2010 to 2026. We cannot test for things that didn't happen during this period
The scripts are available for download. sim-distillation-real-data.py / lib_waves.py / fetch_wave_data.py (Python + NumPy + pandas + yfinance, fixed random seed). Run fetch_wave_data.py first, then the main script, and you'll get the same numbers as in this article. Add your own logic to STRATEGIES in lib_waves.py and you can run the same test with your own approach.
FAQ
Q. Is "diversification is the only free lunch" actually true?
The "free lunch" part is true; "only" is an overstatement. In this test, we cut the total-wipeout rate by 32x and the spread by 60%, while giving up only about 10% of expected net payout. That's undeniably free food. However, prop firms have other things that work for free too — fee discounts, choosing plans with a good target-to-max-drawdown ratio, cutting lot size once you reach Funded, and so on. The more accurate statement is that diversification is the single most powerful one.
Q. Does running the same strategy across multiple accounts count as diversification?
Not at all. In this test, whether you ran 1 account or 20, the total-wipeout rate stayed at 58.4% and the reach rate at 23.8% — not a single digit moved. Running the same strategy over the same period means every account experiences the same price action, so it's the same as copying one account multiple times. Staggering the purchase timing doesn't change this either, since the position you hold on any given day still points the same direction.
Q. How many different strategies should I split across?
Start with 2, and ideally 3–5. The total-wipeout rate goes from 58.4% (1) → 37.2% (2) → 21.8% (3) → 8.8% (5) → 1.8% (10), but the biggest gains come from adding the first 1–2. Going up to 10 is worth it, but given the extra management effort and rule constraints (like caps on account count), 3–5 is a realistic landing point.
Q. How do I pick "strategies that aren't similar"?
The first step is not picking by performance. Lining up recently top-performing strategies pushed correlation from 0.003 up to 0.209. That's because things that respond to similar market conditions cluster together. Three practical axes are: change the symbol, change the direction of the logic (trend-following vs. mean-reversion), and change the time window. If you're unsure, actually calculate the correlation of past daily P&L. If it's above 0.3, it can't really be called a separate strategy.
Q. What if all I have are highly correlated strategies?
Adding more won't help. A set of strategies with correlation 0.8 only brings risk down to 89.6% even with 100 of them lined up, and to 0.906 with 10. In this case, it's more valuable to find one genuinely different strategy than to add more of what you have. If you only have trend-followers, get a mean-reversion strategy; if you only trade FX, add stock indices — that direction.
Q. If concentration has higher expected value, shouldn't I concentrate?
If you can repeat the bet many times, yes. In this test too, putting all accounts on the single best-performing strategy gave twice the expected net payout of diversification (+$23,011 vs. +$11,439). But the probability of ending in profit is only 18.5%. You lose 4 times out of 5. If your fee budget were infinite and you could keep going until you converge on the average, concentration would be correct — but a total wipeout usually means you can't buy the next attempt. With that constraint, diversification becomes the practical answer.
Q. Are there any downsides to diversification?
Management cost, and rule constraints. More accounts means more effort tracking each one's rules, payout cycle, and remaining drawdown room. Also, some firms ban holding opposite positions across accounts if you hold multiple accounts, so when running trend-following and mean-reversion at the same time, you need to check whether their time windows overlap. On the expected-value side, based on this test, the cost of diversification is essentially zero.
Related articles
Written by
Hosono P | the prop firm strategist
I buy challenges with my own money and record everything through to the payout. Recorded payouts: ¥6.1M in total from Fintokei, Fundora and Funded7, plus $4,776 from The5ers (as of September 2026). Author of the semi-discretionary EA "ELDRA".