Don't Smooth Out Your Equity Curve in Prop Trading: Why It's the Exact Opposite of Normal Portfolio Management
※ This article is not a Monte Carlo simulation — it's a backtest that runs real strategies through their actual real-world sequence of data. It does not guarantee future performance and is not investment advice. Assumptions and limitations are stated at the end.
Investing textbooks all say the same thing: "maximize return per unit of risk." For the same profit, less volatility is always better.
In a prop firm challenge, this flips.
Why it flips
There are two reasons, and both come from the structure of the challenge product itself.
① Payout is decided by a threshold
Prop firms only pay out based on whether you hit "+8% or not." An account that finishes at +7.9% and one that finishes at −5% both receive exactly the same amount: zero. A beautifully smooth, steadily rising curve gets no credit if it never crosses the threshold.
② Downside is capped at the fee
With your own capital, −50% really is −50%. Hit the wall in a prop challenge, and all you lose is the fee you paid. Past a certain depth, the downward spike is free.
Normal trading … both upside and downside are yours → volatility is the enemyProp trading … upside gets cashed out, downside is capped → volatility is your friendOnly the upside gets converted to cash, while the downside stops partway. As long as this asymmetry exists, volatility is an asset.
A smoothed-out account is "alive but never earns"
This is the part that's most commonly misunderstood. An account with tightly reined-in lot size never hits the wall. Drawdown stays shallow, no blowups. At a glance, it looks like a model student.
But it also never reaches the target.
| Per-trade volatility multiplier | 1-year result | What's happening |
|---|---|---|
| 0.5x | −¥30K | Never hits the wall, but never reaches +8% either. Just pays the fee |
| 1.0x | +¥180K | Finally starts reaching the target |
| 3.0x | +¥1.74M | Reaches it reliably |
| 6.0x | +¥3.21M | Reaches it best |
| 8.0x | +¥1.13M | Starts hitting the wall before reaching the target |
※ Result of running JP225's Monday anomaly through real data ($100K-equivalent, 2-Phase 8% → 5%, max DD 10%).
A 0.5x account is "safe," but it's just a machine for paying fees forever. No losses, but no gains either. In prop trading, the worst state isn't a blowup — it's this state of being "alive but never reaching the target."
But there is a cliff — and its location varies a lot
Here's the real subject of this article. "Volatility is your friend" isn't unconditional. It's your friend right up until you hit the wall.
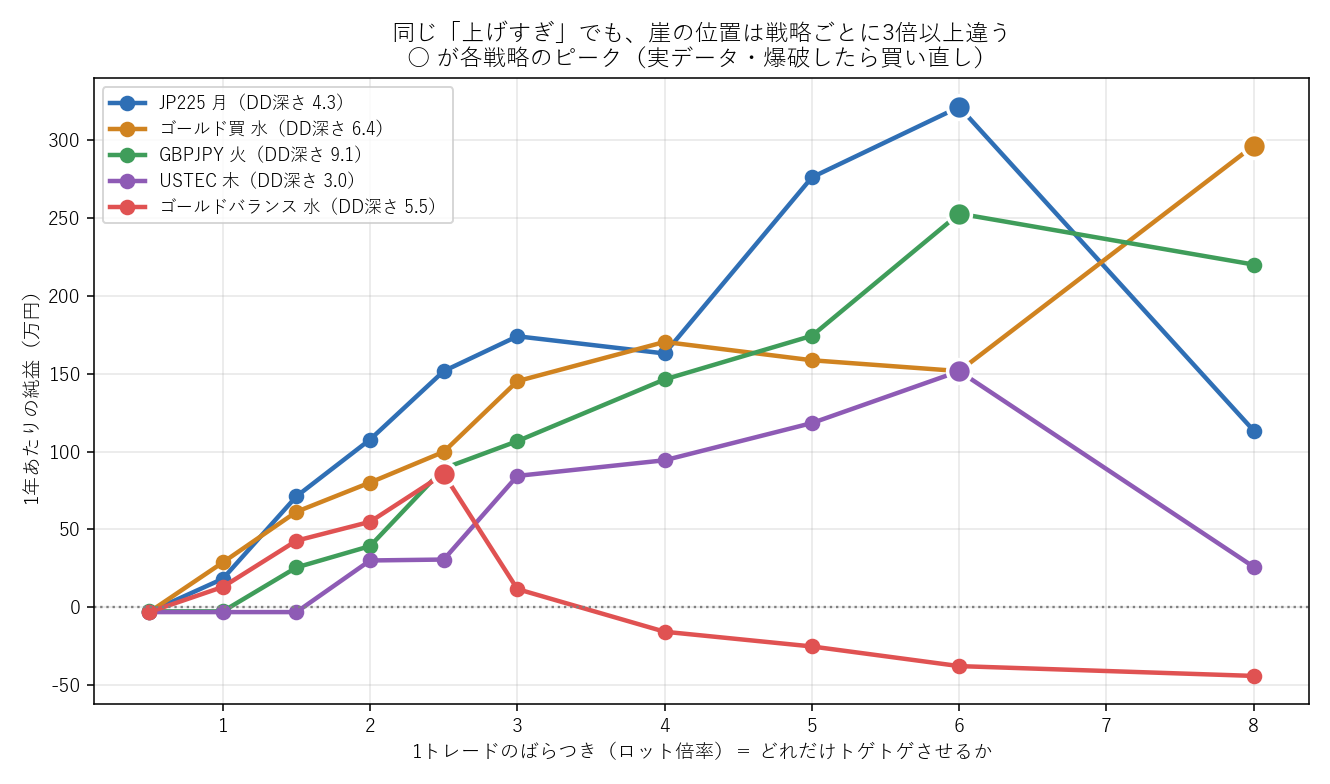
| Strategy | Drawdown depth | Peak | At 2x the peak multiplier |
|---|---|---|---|
| USTEC Thu | 3.0 | 6.0x (+¥1.52M) | +¥260K |
| JP225 Mon | 4.3 | 6.0x (+¥3.21M) | +¥1.13M |
| Gold balanced Wed | 5.5 | 2.5x (+¥860K) | −¥160K |
| Gold long Wed | 6.4 | 8.0x (+¥2.97M) | — |
| GBPJPY Tue | 9.1 | 6.0x (+¥2.53M) | +¥2.20M |
Only the gold balanced strategy (the red line) falls off the cliff at 2.5x and sinks into negative territory from there on. This is in stark contrast to the other strategies, which keep climbing to 6x–8x.
Even though "raising leverage" sounds like a single action, the right amount differs by more than 3x depending on the strategy, and the penalty for overshooting is completely different too. Raising it uniformly across strategies means walking straight onto that red line for at least one of them.
What determines the cliff's location
You'd think "the more volatile a strategy is, the more dangerous it is" — but that's not what we found. What actually mattered was drawdown depth.
With per-trade standard deviation normalized to 1%, how deep does max drawdown sink? → USTEC Thu only sinks to 3.0% → GBPJPY Tue sinks to 9.1%Since the 10% max-DD wall is fixed, the more deeply a strategy tends to sink, the more its lot size gets restricted.
Lot size ceiling ≈ 10 ÷ drawdown depthIt's not win rate, not profit factor — "how deeply does it sink for a given amount of per-trade volatility" is what determines the ceiling. A strategy that gets ground down gradually (one with long losing streaks) can't run much lot size, even if it wins in the end.
So don't diversify "inside" an account
This is the part that matters most in practice.
When you're holding multiple strategies, you have two choices.
A … Put all 5 strategies into a single account (rotate a different strategy each weekday)B … Put one strategy into each of 5 separate accountsA becomes smooth. If the strategies are uncorrelated, their volatility cancels out and the Sharpe ratio rises. For normal portfolio management, A is the right answer.
When we actually measured it, A's single account reached an annualized Sharpe of 2.25 — clearly higher than any individual strategy (0.84–2.15).
And yet B still won.
| Combined into 1 account | Split into 4 accounts | |
|---|---|---|
| Annualized Sharpe | 2.25 | 0.84–2.15 |
| 1-year net profit | +¥4.02M | +¥5.36M |
The reason is simple: prop revenue equals "expected value per account × number of accounts." Combining raises the former, but cuts the latter to a quarter. And payouts only ever happen per account.
One smooth, strong account beats out to less money than four bumpy, decent accounts.
But sometimes bundling is the right call
The exception is a weak strategy that can't reach the threshold on its own.
A strategy that can't hit +8% by itself stays at ¥0 no matter how many separate accounts you split it into. In this case, it's better to bundle it to increase trade frequency and get it over the line at least once. In fact, when we bundled 4 weak strategies — each with a standalone Sharpe of only −0.03 to +0.96 — the bundled version came out ¥1M ahead of splitting them.
A strategy that reaches the threshold alone → split it (more sources of payout)A strategy that can't reach the threshold alone → bundle it (get it over the line)The right answer flips depending on whether you diversify "inside an account" or "across accounts."
So should you just "push it right to the edge"?
The direction is right. But you can't precisely measure where "the edge" actually is.
We applied 3 different methods to the same data, and got wildly different answers.
| Method | GBPJPY Tue's ceiling |
|---|---|
| Cut at the worst historical drawdown | 1.1x |
| Block bootstrap | 6.0x is optimal |
| Run through the real, actual sequence | 6.0x is optimal |
Optimal leverage is a parameter determined by the tail with the least available data (the sequence of losing streaks). With only 2–3 years and roughly 100 trades, precision is fundamentally out of reach.
And the penalty for missing is asymmetric.
- Too low … you simply leave money on the table (+¥3.21M becomes +¥1.08M)
- Too high … you fall into negative territory (+¥860K becomes −¥160K)
That's why, in practice, we think starting at roughly half your estimated optimal value is the sensible approach. You capture most of the upside while sharply reducing the odds of walking off the cliff.
Summary
- Prop pays out via a threshold and caps downside at the fee. That's why volatility is your friend
- The worst state isn't a blowup — it's being "alive but never reaching the target." An account with too little lot size becomes a machine for paying fees
- But there is a cliff, and its location varies more than 3x by strategy
- What determines the cliff is drawdown depth (how far it sinks for a given amount of per-trade volatility) — not win rate, not profit factor
- Diversifying inside a single account smooths it out, but keeps it from reaching the threshold. Diversify across accounts instead
- Only bundle a weak strategy that can't reach the threshold on its own
- Optimal leverage can't be measured precisely. Start from half your estimate
The scripts are available for download. Download sim-prop-spiky-vs-smooth.py (Python + NumPy + pandas). Add your own strategies to WAVES to produce the same cliff chart. See fetch_wave_data.py for fetching price data.
FAQ
Q. Does this mean I should take on more risk in prop trading?
Yes — right up until you hit the wall. Since payout is decided by a threshold ("did you hit +8%") and downside is capped at the fee, only the upside side of volatility gets converted into cash. But this isn't unconditional, because exceeding max drawdown ends the account. In this backtest, one strategy fell into negative territory as soon as it passed 2.5x. The accurate framing isn't "take risk" — it's "don't take too much, and don't restrict too much."
Q. Isn't a smaller lot size safer?
It won't blow up, but it won't earn either. An account with volatility scaled down to 0.5x never hit the wall, but it also never reached +8% — ending the year at −¥30K (roughly the fee). In prop trading, the worst state isn't a blowup — it's being "alive but never reaching the target." No loss, no gain — just the fee draining away.
Q. How should I determine the right lot size?
Measure "how many times max drawdown sinks relative to per-trade volatility." Once you know that, you can approximate it as lot ceiling ≈ max DD% ÷ sink depth. Across the 5 strategies tested here, that depth ranged from 3.0 to 9.1 — a 3x spread — and the ceiling shifted accordingly. It's not determined by win rate or profit factor.
Q. If I have multiple strategies, should I combine them into one account?
If a strategy reaches the target on its own, split it up. Combining raises Sharpe (up to 2.25 in our measurement), but it also reduces the number of accounts, which reduces sources of payout. In this backtest, splitting came out ¥1.34M ahead. Conversely, a weak strategy that can't reach the target alone is better off combined, to increase trade frequency. The decision to split or combine comes down to whether the strategy reaches the threshold on its own.
Q. Does this mean normal investing wisdom doesn't apply?
It doesn't apply in the sense that risk-management thinking has to change. In normal trading, both upside and downside are yours, so volatility is the enemy — but prop trading has an asymmetry where upside gets cashed out and downside is capped at the fee. That said, drawdown management itself is unchanged — hitting the wall still ends the account either way. Think of the asymmetry as only applying inside the wall.
Q. Can optimal leverage be calculated precisely?
No, precision isn't achievable. Applying 3 different methods to the same data, one strategy's ceiling came out as either 1.1x or 6.0x depending on the method. Optimal leverage is a value determined by the sequence of losing streaks (the tail) — precisely the area where you have the least data. And since the penalty for missing is asymmetric (too low just costs you upside; too high drops you into negative territory), starting at roughly half your estimate is the practical approach.
Assumptions and limitations of this backtest
- The dataset is 5 intraday-anomaly strategies built from real prices from April 2024 to September 2026. That's only 2.4 years
- Each strategy has 100–145 trades. The standard error on Sharpe is roughly ±0.6, so rankings can shuffle
- Spread is deducted, but slippage, swap, and rejected orders are not modeled
- The hard stop-loss is judged by the maximum adverse move from entry. Actual gap-fills aren't reproduced
- Minimum trading days, consistency rules, and payout cycles are not modeled
- The cliff's location is measured from a single actual sequence. It would shift with a different time period
- Every dollar figure in this article carries an upward bias. Trust the shape and the ranking, not the absolute numbers
Related articles
Written by
Hosono P | the prop firm strategist
I buy challenges with my own money and record everything through to the payout. Recorded payouts: ¥6.1M in total from Fintokei, Fundora and Funded7, plus $4,776 from The5ers (as of September 2026). Author of the semi-discretionary EA "ELDRA".