Moneta 2-Step: Should You Pick 4%/8% or 5%/10%? | What a 44% Price Gap Actually Buys You, Tested Across 40,000 Runs
Note: This article is a simulation-based analysis, not investment advice. Prices and rules are the values measured directly at the official checkout and help center on September 12, 2026.
On Moneta Funded's 2-Step challenge, the purchase screen gives you a choice of two drawdown configurations.
- 4% Daily loss / 8% Max loss
- 5% Daily loss / 10% Max loss
For a $100K account, that's $660 vs. $950. The price gap is 44%. I ran 40,000 Monte Carlo simulations to find out what that extra 44% actually buys.
TL;DR
- The price gap sits at roughly 1.4x across every size. $660 vs. $950 at $100K, $71 vs. $105 at $10K. The coupon
TOKONATSU50works on both, bringing $100K down to $330 vs. $475 - The difference that matters most is "target ÷ loss allowance." The Phase 2 target is 10% on both, but the loss allowance is 8% vs. 10%. 4%/8% requires you to earn 1.25x your allowed loss allowance, while 5%/10% is exactly 1.00x. The structure of "you can only lose 8% but must win 10%" is what's biting here
- What you're buying is a "lower failure rate." Running the same skill level and the same lot size, the failure rate drops 88.2%→81.1% (zero edge) and 49.4%→36.8% (small edge) — a drop of up to 12 points
- In absolute terms, 5%/10% always wins. The margin — expected payout minus the fee — favors 5%/10% at every skill level (+1.017% vs. +0.838% at zero edge)
- In capital efficiency, 4%/8% always wins. The multiple on every dollar of fee is 3.54x vs. 3.14x at zero edge and 258x vs. 183x at strong edge. The ranking never flips no matter the skill level
- For the same budget, buying multiple 4%/8% accounts has a higher expected value. Buying 1.44x worth of 4%/8% for $950 beats buying one 5%/10% account (+1.207% vs. +1.017%)
- The easily-missed risk is holding a position open. Every check is based on equity, so a floating loss counts directly against the failure line. And carrying a position across the rollover shrinks tomorrow's allowance. Carrying a +$1,000 floating profit pushes the failure line up, and your usable allowance becomes $3,000 instead of $4,000
- The same-instrument floating-loss trigger is 2% on the 4% configuration and 3% on the 5% configuration (funded accounts). On $100K/EURUSD that's 200 pips vs. 300 pips on a single lot. Trip it and you get a full close-out plus a same-day trading halt, on top of 14 days under a strict 1.5%-per-trade-idea limit
- Bottom line: if you're betting on one account, go 5%/10%; if you're going to buy repeatedly, go 4%/8%. For an EA that holds multiple positions at once, the floating-loss trigger gap adds another reason to pick 5%/10%
What Actually Differs Between the Two Configurations
Only 3 things differ. Everything else is exactly the same.
| 4%/8% | 5%/10% | |
|---|---|---|
| Daily loss | 4% | 5% |
| Max loss (static) | 8% | 10% |
| Same-instrument floating-loss trigger | 2% | 3% |
| Profit target | Phase 1 5% → Phase 2 10% | Same |
| Min. profitable days | 3 days per phase | Same |
| Trading deadline | None | None |
| Leverage | 1:100 | 1:100 |
| Profit split | 88% | 88% |
| Payout | Every 14 days, from $100 | Same |
| Fee refund | In full on the 4th payout | Same |
Max loss is static on both. It's fixed against the initial balance and doesn't move as the account grows. It's not trailing, so the more you grow profit, the more room you gain.
A profit target of 5% in Phase 1 and 10% in Phase 2 is the reverse of the industry-standard order. The back half is heavier, so watch out for the pattern of breezing through Phase 1 and then failing Phase 2.
Phase 2 Demands 'More Profit Than Your Loss Allowance'
This is the part of the two-configuration difference that matters most. Try dividing the target by the loss allowance.
| 4%/8% | 5%/10% | |
|---|---|---|
| Phase 1: target ÷ max loss | 5% ÷ 8% = 0.63 | 5% ÷ 10% = 0.50 |
| Phase 2: target ÷ max loss | 10% ÷ 8% = 1.25 | 10% ÷ 10% = 1.00 |
On the 4%/8% configuration, Phase 2 is effectively telling you to earn 1.25x your allowed loss allowance. You can only lose 8%, yet you have to win 10%. It's a structure of "hit a target bigger than the ammo you're given."
On 5%/10%, the target and loss allowance are exactly 1:1. Even though the target is the same 10%, the weight of risk you're carrying is different.
This ratio difference shows up later as the difference in funded-reach rate (27.1% vs. 32.4%). The 44% price gap is better understood not as "2 points of drawdown," but as "whether the container is big enough for the target."
Note that on both configurations, the target in Phase 1 is smaller (0.63 and 0.50), so few people get stuck here. It's Phase 2 where people get stuck.
The Price Gap Is About 1.4x Across Every Size
I measured every size directly at checkout on September 12, 2026.
| Account size | 4%/8% | 5%/10% | Difference | Multiple |
|---|---|---|---|---|
| $5K | $33 | $45 | +$12 | 1.36x |
| $10K | $71 | $105 | +$34 | 1.48x |
| $25K | $169 | $245 | +$76 | 1.45x |
| $50K | $365 | $526 | +$161 | 1.44x |
| $100K | $660 | $950 | +$290 | 1.44x |
The coupon TOKONATSU50 (50% off) applies to both configurations. Testing it on $100K, 4%/8% went $660→$330 and 5%/10% went $950→$475. Switching configurations drops the coupon, so apply it only after you've decided on your configuration.
The rest of this simulation is calculated using these post-coupon prices.
What the 44% Price Gap Buys You: Failure Rate
Running the same skill level, same lot size, and same time period. Per trade: with probability p, +R×r; on a loss, −r. 3 trades a day, 1% risk per trade, 120 trading days, 40,000 runs.
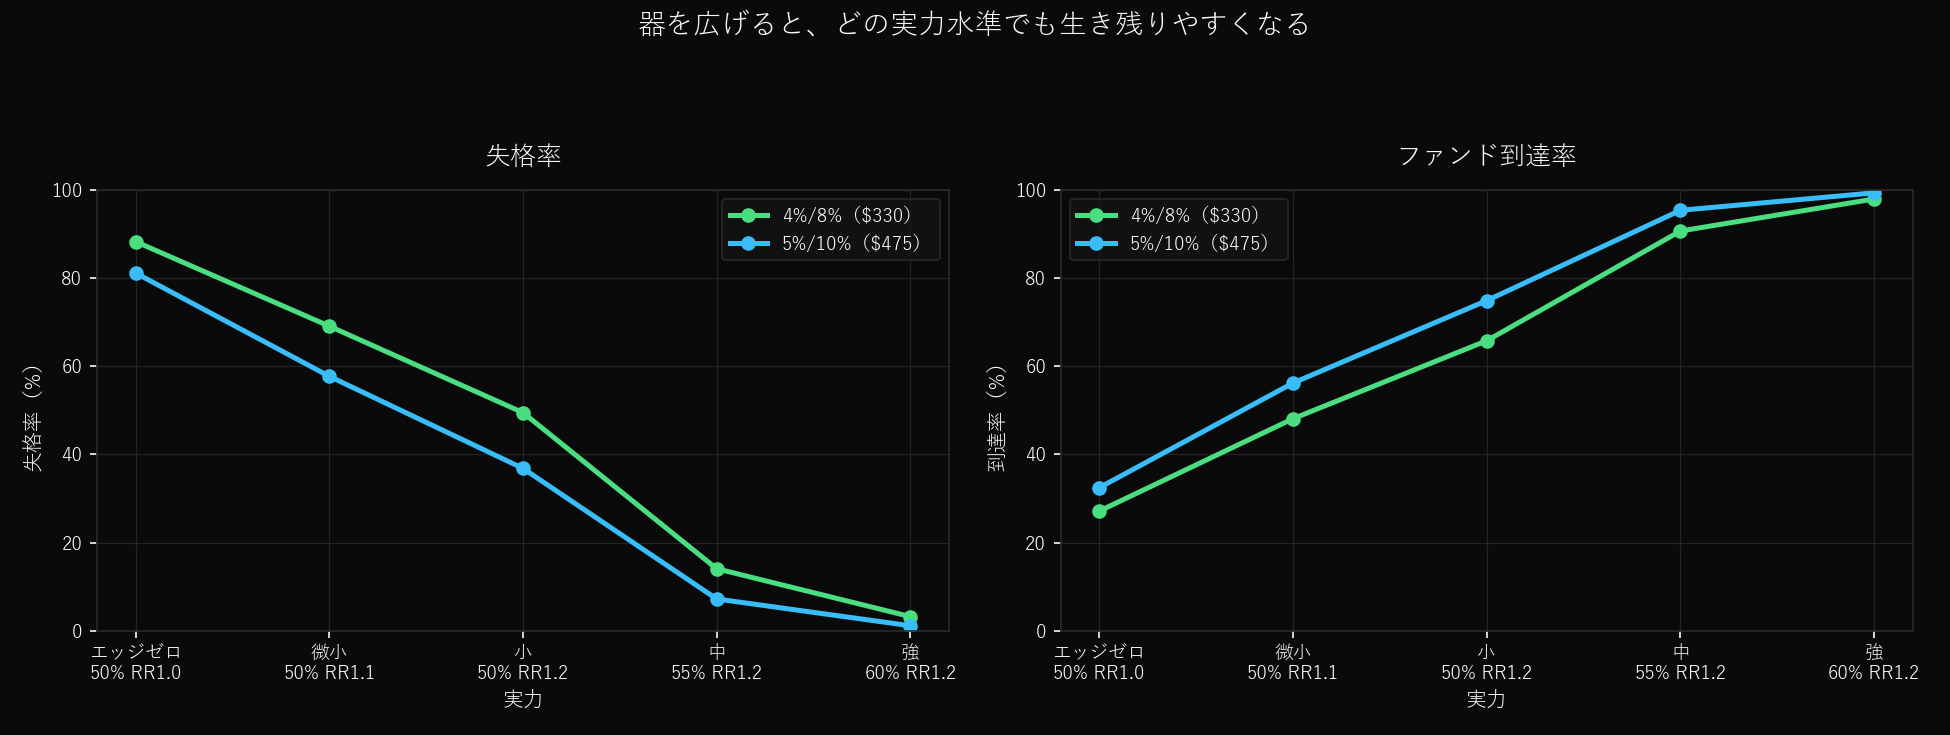
| Skill (60-day equivalent) | 4%/8% failure rate | 5%/10% failure rate | Diff | 4%/8% funded-reach | 5%/10% funded-reach |
|---|---|---|---|---|---|
| Zero edge (50%, RR1.0) | 88.2% | 81.1% | −7.1pt | 27.1% | 32.4% |
| Tiny (50%, RR1.1) | 69.1% | 57.7% | −11.4pt | 48.1% | 56.2% |
| Small (50%, RR1.2) | 49.4% | 36.8% | −12.6pt | 65.8% | 74.9% |
| Medium (55%, RR1.2) | 14.1% | 7.2% | −6.9pt | 90.6% | 95.3% |
| Strong (60%, RR1.2) | 3.2% | 1.1% | −2.1pt | 97.9% | 99.3% |
The effect is largest for people with a small edge. The failure rate drops by 12.6 points and the funded-reach rate rises by 9.1 points.
At both extremes the gap narrows. At zero edge, roughly 80% fail either way; with a strong edge, nearly everyone passes either way. The extra $290 pays off the most for someone who's one step away from being consistent.
The Gap Widens as You Raise Lot Size
| Risk per trade | 4%/8% failure rate | 5%/10% failure rate | Diff |
|---|---|---|---|
| 0.50% | 12.4% | 5.7% | −6.7pt |
| 0.75% | 33.3% | 21.6% | −11.7pt |
| 1.00% | 49.4% | 36.8% | −12.6pt |
| 1.25% | 58.6% | 47.0% | −11.6pt |
Fixed at 50% win rate, RR1.2
If you size small, the gap is small. You're not using up the full container, so paying for a bigger one has less point. Conversely, if you're sizing 1% or more, the value of the bigger configuration shows up clearly.
Absolute Amount or Capital Efficiency
This is where the decision splits. Here's the margin — expected payout (i.e., the ceiling you should be willing to pay) minus the fee — alongside the multiple, the ceiling divided by the fee.
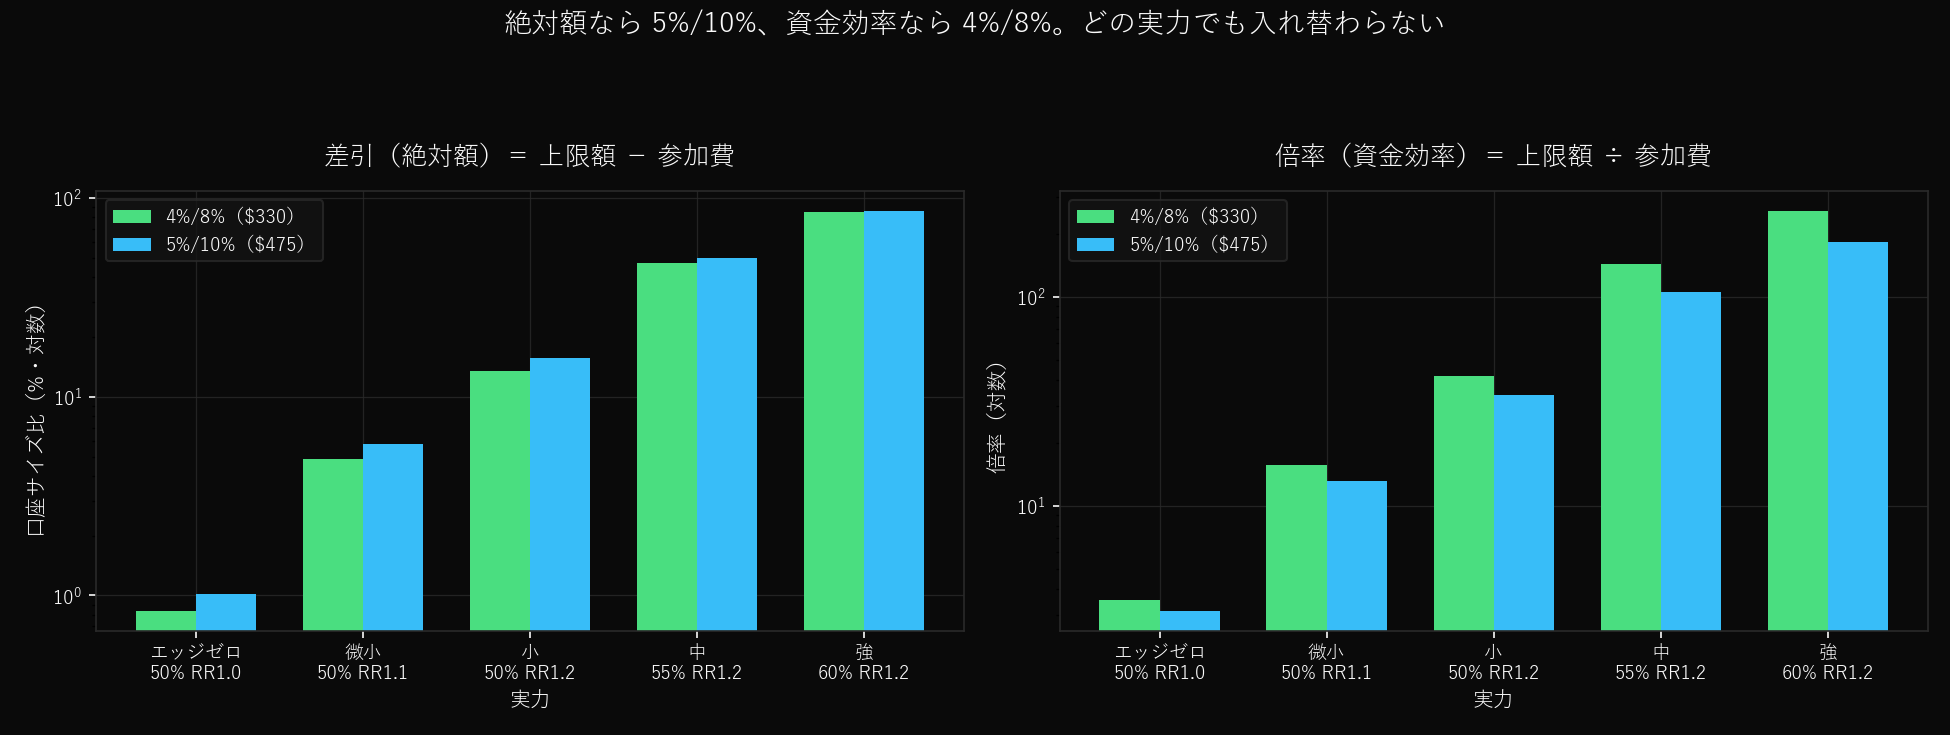
| Skill | 4%/8% margin | 5%/10% margin | 4%/8% multiple | 5%/10% multiple |
|---|---|---|---|---|
| Zero edge | +0.838% | +1.017% | 3.54x | 3.14x |
| Tiny | +4.862% | +5.762% | 15.73x | 13.13x |
| Small | +13.483% | +15.586% | 41.86x | 33.81x |
| Medium | +46.868% | +49.655% | 143.02x | 105.54x |
| Strong | +84.867% | +86.274% | 258.17x | 182.63x |
Figures are % of account size
It splits cleanly. In absolute amount, 5%/10% wins at every skill level; in multiple, 4%/8% wins at every skill level. The ranking never once flips.
The reason is simple: the bigger container raises your survival rate, but the price increase is larger than that improvement. The failure rate improves by up to 12 points, but the price rises by 44%.
Comparing on the Same Budget Settles It
If you level the comparison on the premise of "spending $950," you can buy 1.44x worth of 4%/8%.
| How you spend $950 | Expected margin |
|---|---|
| One 5%/10% account | +1.017% |
| 1.44x worth of 4%/8% | +1.207% |
For the same amount of money, buying more of the cheaper one has a higher expected value. The gap in multiples carries straight through.
There's a real-world catch, though. Running multiple accounts at once means touching the same market with the same method, so they aren't independent. When one blows up, they tend to blow up together. The calculation above assumes each account is independent, so the actual diversification effect will be smaller than this.
The Risk of Leaving a Position Open
This is actually the part that matters most. Every check at Moneta is based on equity, so even an unrealized floating loss counts directly toward the failure line.
1. Floating Losses Count Against Both Max Loss and Daily Loss
The official wording is "max loss is measured against whichever is higher, balance or equity" and "a breach occurs when equity falls below the failure line." In other words, it won't wait for you if you leave a floating loss sitting there.
In dollar terms at $100K, the lines look like this.
| 4%/8% | 5%/10% | |
|---|---|---|
| Max loss (static, equity check) | Fail below $92,000 | Fail below $90,000 |
| Daily loss allowance per day | $4,000 | $5,000 |
| Same-instrument floating-loss trigger (funded account) | $2,000 | $3,000 |
2. Carrying a Position Across the Rollover Shrinks Tomorrow's Allowance
The daily failure line is set by a snapshot taken every day at 22:00 UTC. The rule is:
Take whichever is higher, balance or equity, and subtract the daily loss amount from it — that's the failure line for the next day. However, breach checks are done against equity.
This "take whichever is higher" is the trap: if you carry a position across the rollover, your allowance shrinks the next day whichever way it goes. Here's the official worked example ($100K, 4% daily = $4,000) laid out both ways.
| At rollover | Balance | Equity | Failure line | Real allowance usable next day |
|---|---|---|---|---|
| Flat, no position | $100,000 | $100,000 | $96,000 | $4,000 |
| Holding a +$1,000 floating profit | $100,000 | $101,000 | $97,000 | $3,000 (viewed from balance) |
| Holding a −$1,000 floating loss | $100,000 | $99,000 | $96,000 | $3,000 (viewed from current value) |
Holding a floating profit is the especially awkward case. The snapshot takes the higher figure — equity at $101,000 — so the failure line rises to $97,000. A profit that hasn't even been realized ends up pushing next day's failure line up. If that position merely returns to breakeven, only $3,000 of allowance is left.
The floating-loss side gets cut by exactly the same amount. The line stays at $96,000, but equity is already at $99,000, so what's left is $3,000.
In other words, the absolute value of the floating P&L at the moment of rollover is subtracted straight out of the next day's allowance. If you're going to carry a position over, you need to size your lots with this erosion in mind.
And the 4% configuration hurts more. For the same $1,000 of floating P&L, it's the difference between losing 25% of a $4,000 allowance or losing 20% of a $5,000 allowance. This is where the reason to choose 5%/10% for swing trading or holding over the weekend comes from.
The firm itself, incidentally, does not recommend trading around the rollover at all, because spreads widen and volatility rises.
3. Same-Instrument Floating-Loss Trigger: 2% vs. 3%
Funded accounts have a trigger for "how much floating loss on the same instrument forces a stop," and this changes by configuration.
Hit it and all open positions in that instrument get closed and trading is halted for the day. On top of that, the account is moved to a strict 1.5%-per-trade-idea cap. Lifting this restriction requires 14 days and 20 trades on a separate funded account. It's not a disqualification, but it leaves you unable to operate properly for two weeks.
Converting to lots makes the difference concrete. Here's a rough guide for $100K/EURUSD (1 pip per lot = $10).
| 4%/8% ($2,000) | 5%/10% ($3,000) | |
|---|---|---|
| Adverse move survivable on 1 lot | 200 pips | 300 pips |
| Up to a 50-pip move | 4 lots | 6 lots |
| Up to a 100-pip move | 2 lots | 3 lots |
| 1 lot after being restricted (1.5% = $1,500) | 150 pips | 150 pips |
On 5%/10%, you can hold 1.5x the lot size for the same adverse move. This matters for people like:
- An EA that splits entries into the same instrument. Splitting 0.7% into 3 entries gets you to 2.1%, which trips the 4% configuration instantly
- A trend-following style that lets floating losses run
- A method that trades across news events or holds swing positions, where a temporarily large adverse move is possible
For a one-position-at-a-time, fixed-SL, same-day-close method, this difference is barely relevant.
This trigger, incidentally, is officially explained as a funded-account rule. I couldn't find an equivalent trigger described in the help center for the evaluation phases (Phase 1/2). So the 2% vs. 3% gap only starts mattering after you've passed both phases.
Conclusion: Which Should You Pick?
First. If you're betting on a single account, go with 5%/10%. The margin (absolute amount) is higher at every skill level, and the failure rate is lower too. Dropping the failure rate by up to 12 points for an extra $290 is straightforwardly worth it for someone betting on one account.
Second. If you're going to buy repeatedly, go with 4%/8%. Capital efficiency is higher on 4%/8% at every level, and spreading the same budget across more accounts has a higher expected value. If your premise is "fail, then buy again," go cheap.
Third. The effect is biggest for someone "one step away." The improvement in failure rate is largest for people with a small edge (12.6 points), and the gap narrows for people at zero edge or people already strong enough. Where you personally sit changes what that $290 is worth.
Fourth. If you size at 1% or more per trade, go with 5%/10%. At 0.5% the gap is 6.7 points, but at 1% it's 12.6 points. The more fully you use up the container, the more the bigger container is worth. Conversely, if you size small, 4%/8% is plenty.
Fifth. If you carry positions over, go with 5%/10%. Since checks are equity-based, a floating loss counts directly, and carrying across the rollover shrinks the next day's allowance by exactly the absolute value of the floating P&L. Carrying the same $1,000 over is the difference between losing 25% of a $4,000 allowance or 20% of a $5,000 one. If you're doing swing trading, holding over the weekend, or trading across news, go with the wider one.
Sixth. If you hold multiple positions in the same instrument, go with 5%/10%. The floating-loss trigger goes from 2% to 3%, which on $100K/EURUSD turns 200 pips into 300 pips on a single lot. Trip it once and you're under a strict 1.5% cap for 14 days, so for anyone running a split-entry EA, this alone is reason enough to choose it.
Assumptions and Limitations
- Spread, commission, and swap aren't included. Adding real costs would lower the numbers on both
- The floating-loss trigger (2%/3%) and rollover carry-over aren't implemented in the simulation. A discrete, per-trade model can't represent how a floating loss evolves over time, so the article treats it as a qualitative difference based on the official worked examples. Implementing it would likely widen the disadvantage for 4%/8% a bit further
- This simulation assumes positions aren't carried over. For a method that does carry them over, both configurations' numbers get worse to the extent that the next day's allowance shrinks, as described above
- Minimum profitable days (3 per phase) also isn't implemented
- This is a model where you don't retry after failing. In reality you can buy again, so the real-world expected value of the cheaper 4%/8% is a bit better than shown
- Multiple accounts are assumed to be independent. In reality they're correlated because you run the same method on them simultaneously, so the effect of the "buy more accounts" strategy is smaller than the calculation shows
- Wins and losses are assumed to be independent. Real markets cluster losing streaks, so both configurations here are more generous than reality
- The fee refund (in full on the 4th payout) isn't reflected. Since it applies to both under the same condition, the relative conclusion doesn't change, but the absolute figures for both would improve
The script is available for download. Download sim-phases-vs-instant.py (Python + NumPy, fixed random seed). Rewrite the PROGRAMS lines to recalculate with your own win rate, RR, lot size, and time period.
FAQ
Q. Does the coupon work on both configurations?
Yes. Testing it directly at checkout on September 12, 2026, TOKONATSU50 (50% off) applied to both: 4%/8% went $660→$330, and 5%/10% went $950→$475. However, switching configurations drops the coupon. Decide on your configuration, size, and platform first, and enter the code last.
Q. Is max loss static or trailing?
Static on both. It's fixed against the initial balance, and the failure line doesn't move as the account grows. On $100K, it's fixed at $92,000 on the 8% configuration and $90,000 on the 10% configuration. Even within Moneta, Instant Pro is 8% trailing, so that one is a completely different animal.
Q. Why do absolute amount and capital efficiency give opposite answers?
Because the price increase is larger than the improvement in survival rate. The failure rate improves by up to 12 points (a 20–30% relative improvement), but the price rises by 44%. The expected value per account goes up, but the expected value per dollar goes down. That's why the answer changes depending on "how many you buy."
Q. Is it true the profit target goes 5%→10%?
That's what the official help center says. Phase 1 is 5% and Phase 2 is 10%, which is the reverse of the industry-standard "front half is heavy, back half is light" shape. Two-thirds of the combined 15% is concentrated in Phase 2, so you can't get complacent even after passing Phase 1. The target stays the same regardless of which configuration you choose.
Q. Does tripping the floating-loss trigger disqualify you?
No, it's not disqualification. All open positions in that instrument get closed, trading halts for the day, and the account gets moved to the 1.5%-per-trade-idea limit. Disqualification only happens if you exceed that 1.5% afterward. The restriction lifts once you satisfy 14 days and 20 trades on a separate funded account.
Q. Does the same conclusion hold for smaller sizes like $5K or $10K?
The ratio is the same. The price gap is roughly 1.4x across every size, so the conclusion doesn't change as long as you're looking at it as a % of account size. However, the smaller the size, the smaller the absolute-dollar difference (just $12 at $5K), so if you're unsure, choosing the wider one won't hurt much.
Related Articles
Written by
Hosono P | the prop firm strategist
I buy challenges with my own money and record everything through to the payout. Recorded payouts: ¥6.1M in total from Fintokei, Fundora and Funded7, plus $4,776 from The5ers (as of September 2026). Author of the semi-discretionary EA "ELDRA".